Elastic Block Store throughput testing with Orion

By Brian Fitzgerald

Introduction

ORacle I/O Numbers (Orion) results for EBS volumes are presented here. Multiple configurations of EC2 instance type, number of devices, IOPS configuration, and throughput configuration are tested. The objective is to identify the best performing and most economical system for use in Oracle Automatic Storage Management (ASM).

Amazon AWS EC2 EBS

AWS EC2 offers I/O capacity for a price. You get a slice of the underlying hardware’s full bandwidth depending on how much you pay. The actual throughput depends on the EC2 instance’s device controller and the underlying volume. EC2 device controller capacity depends on instance class (m5, r5b, etc.), and size (large, 4xlarge, etc.). EBS volume capacity depends on volume type (gp3, io2, etc.) and configuration (throughput and IOPS). Maximum I/O capacity will be the lesser of EC2 capacity and EBS volume capacity, provided that you get the layout right.

The I/O capabilities of the EBS volume types that were tested are summarized here:

Type gp3 gp2 st1 io2
Purpose General General Low cost High IOPs, low latency
Medium ssd ssd magnetic ssd
Configurable throughput Yes No No No
Maximum throughput configuration (Mbps) 1000
Configurable IOPS Yes Yes
Max IOPS configuration 160000 256,000

The EBS test volumes were not encrypted.

This article places emphasis on optimizing throughput, but some IOPS and latency observations are presented here as well. As a limiting case, we are interested in 100% write I/O throughput capacity.

I/O throughput rating on EC2

We are mainly concerned with the modern, Nitro EC2 m5, c5, r5, and r5b instance types. Throughput is defined as the rate, in Mbps for large (128 KiB) I/O, and could refer to a read, write, or mixed (read-write) workload.

EC2 throughput rating can be found by running “aws ec2 describe-instance-types”, and is divided into two ranges, according to instance size, as shown in the following figure. The number of CPUs in EC2 maps to instance size thus:

Number of CPUs Instance size
2 large
4 xlarge
8 2xlarge
16 4xlarge
32 8xlarge
48 12xlarge
64 16xlarge
96 24xlarge

At the low end, up to 4xlarge, throughput is capped at a single value, regardless of instance size. That cap depends on instance class. In r5b, the cap is 1250 Mbps, but for c5, m5, and r5, throughput is capped at 593.75 Mbps. Other instance classes have lower throughput caps. At the high end, 8xlarge and up, throughput depends on the instance size. The r5b instance class tops out at 7500 Mbps. m5, c5, and r5 classes have throughput that ranges from 850 Mbps to 2375 Mbps, depending on instance type.

By now we have described the available volume types and instance types. So let’s pose this question. If we configure 8 gp3 volumes at 1000 Mbps each, then the system should deliver 8000 Mbps throughput, right?

Wrong.

No EC2-EBS-Linux system today delivers 8000 Mbps throughput. You will get, at best, the throughput offered by the EC2 instance type. For example, if you build an m5.4xlarge instance, then the highest possible throughput will be 593.75 Mbps, as I mentioned. Also, 593.75 Mbps is the most you will get. Actually achieving that requires configuring multiple volumes.

Operating system description

The test system is an Amazon AWS EC2 instance running Red Hat Linux 7.9. The test software is orion, which is found in the Oracle home. The number of CPUs, the amount of memory, and the device controller interface depend on the EC2 instance type. For example, the m5.xlarge has 4 CPUs, 16 GB RAM, and a non-volatile memory express (NVMe) device controller interface.

Test description

100% write I/O was tested with orion. General purpose volumes (gp2 and gp3), and the lower cost st1 storage were tested with large writes. I/O optimized storage (io2) was tested at small I/O. Each test ran from 4 to 20 minutes, depending on the number of volumes. For the throughput tests, “Maximum Large MBPS” was extracted from the summary.txt file. In the small I/O tests, “Maximum Small IOPS” and “Minimum Small Latency” were extracted.

Instance type and volume type

In this section, the influence of instance type and volume type in investigated. The new I/O-optimized r5b instance type was tested with gp3 storage. General purpose m5 instance class was tested with gp2, gp3, and io2 storage. Additionally, the lower cost, burstable t3 instance class, and the previous generation m4 instance class were tested. The number of CPUs ranged from 2 to 96. As a rule of thumb, the amount of memory for the m5, t3, and m4 instance classes, in GB, is four times the number of CPU. Eight 125-GB volumes were tested in every run. In all, there were 31 test runs.

Throughput testing

General  purpose storage was tested for throughput. gp3 storage was configured for 1000 Mbps throughput per volume (the maximum) and 4000 IOPS The results are displayed here.Each point represents the maximum throughput obtained in a single test. The dark blue line, for example, displays Orion throughput results for 6 tests on r5b.large, r5b.4xlarge, r5b.8xlarge, r5b.12xlarge, r5b.16xlarge, r5b.24xlarge, The test points above 24 are results of separate tests on r5b.4xlarge, m5.4xlarge on gp3 volume type, m5.4xlarge on gp2 volume type, t3.4xlarge, m4.4xlarge, and m5.4xlarge on st1 volume type. Again, each point is a separate test, not Orion data points from a single test.

The figure shows actual system throughput for 8 volumes. We already said that just because you configure 8 1000 Mbps volumes does not mean that the observed throughput will be 8000 Mbps. Instead, the throughput is limited by the instance type.

The key points to notice in the throughput testing are:

  • The observed throughput is level across instance types up to 4xlarge (24 CPUs), just like the documentation says.
  • Starting at 8xlarge, (25 CPUs), gp3 throughput scales up with the instance size, reaching 7330 Mbps on the r5b.24xlarge instance type, and 2330 Mbps on m5.24xlarge, again, just like the documentation says.
  • Like gp3 on the m5, gp2 throughput is level at 580 Mbps for instances up to 4xlarge.
  • From 12xlarge and up, gp2 throughput is level at 1015 MPBs.
  • For t3.xlarge and up, throughput plateaus at 335 Mbps.
  • In older instance class m4, throughput ranges from 55 Mbps to 240 Mbps.

Notice that in high-end instance types, r5b throughput is better than 3x the m5 throughput. This is one example where actual observations match the marketing materials: New – Amazon EC2 R5b Instances Provide 3x Higher EBS Performance

By using the number of CPUs on the horizontal axis, we do not mean to imply that CPUs have a significant influence on system throughput in EC2. In fact, during ORION testing, CPU workload tends be low, and the same can be said for memory footprint. Plotting vs “Number of CPUs” is just meant to be a convenient method for having plotting I/O numbers vs instance size. AWS throttles throughput depending on instance type and size, separately from the number of CPUs.

IOPS testing

I/O Optimized storage io2 configured for 7000 IOPS per volume on the m5 class was also tested. 8 volumes were tested.
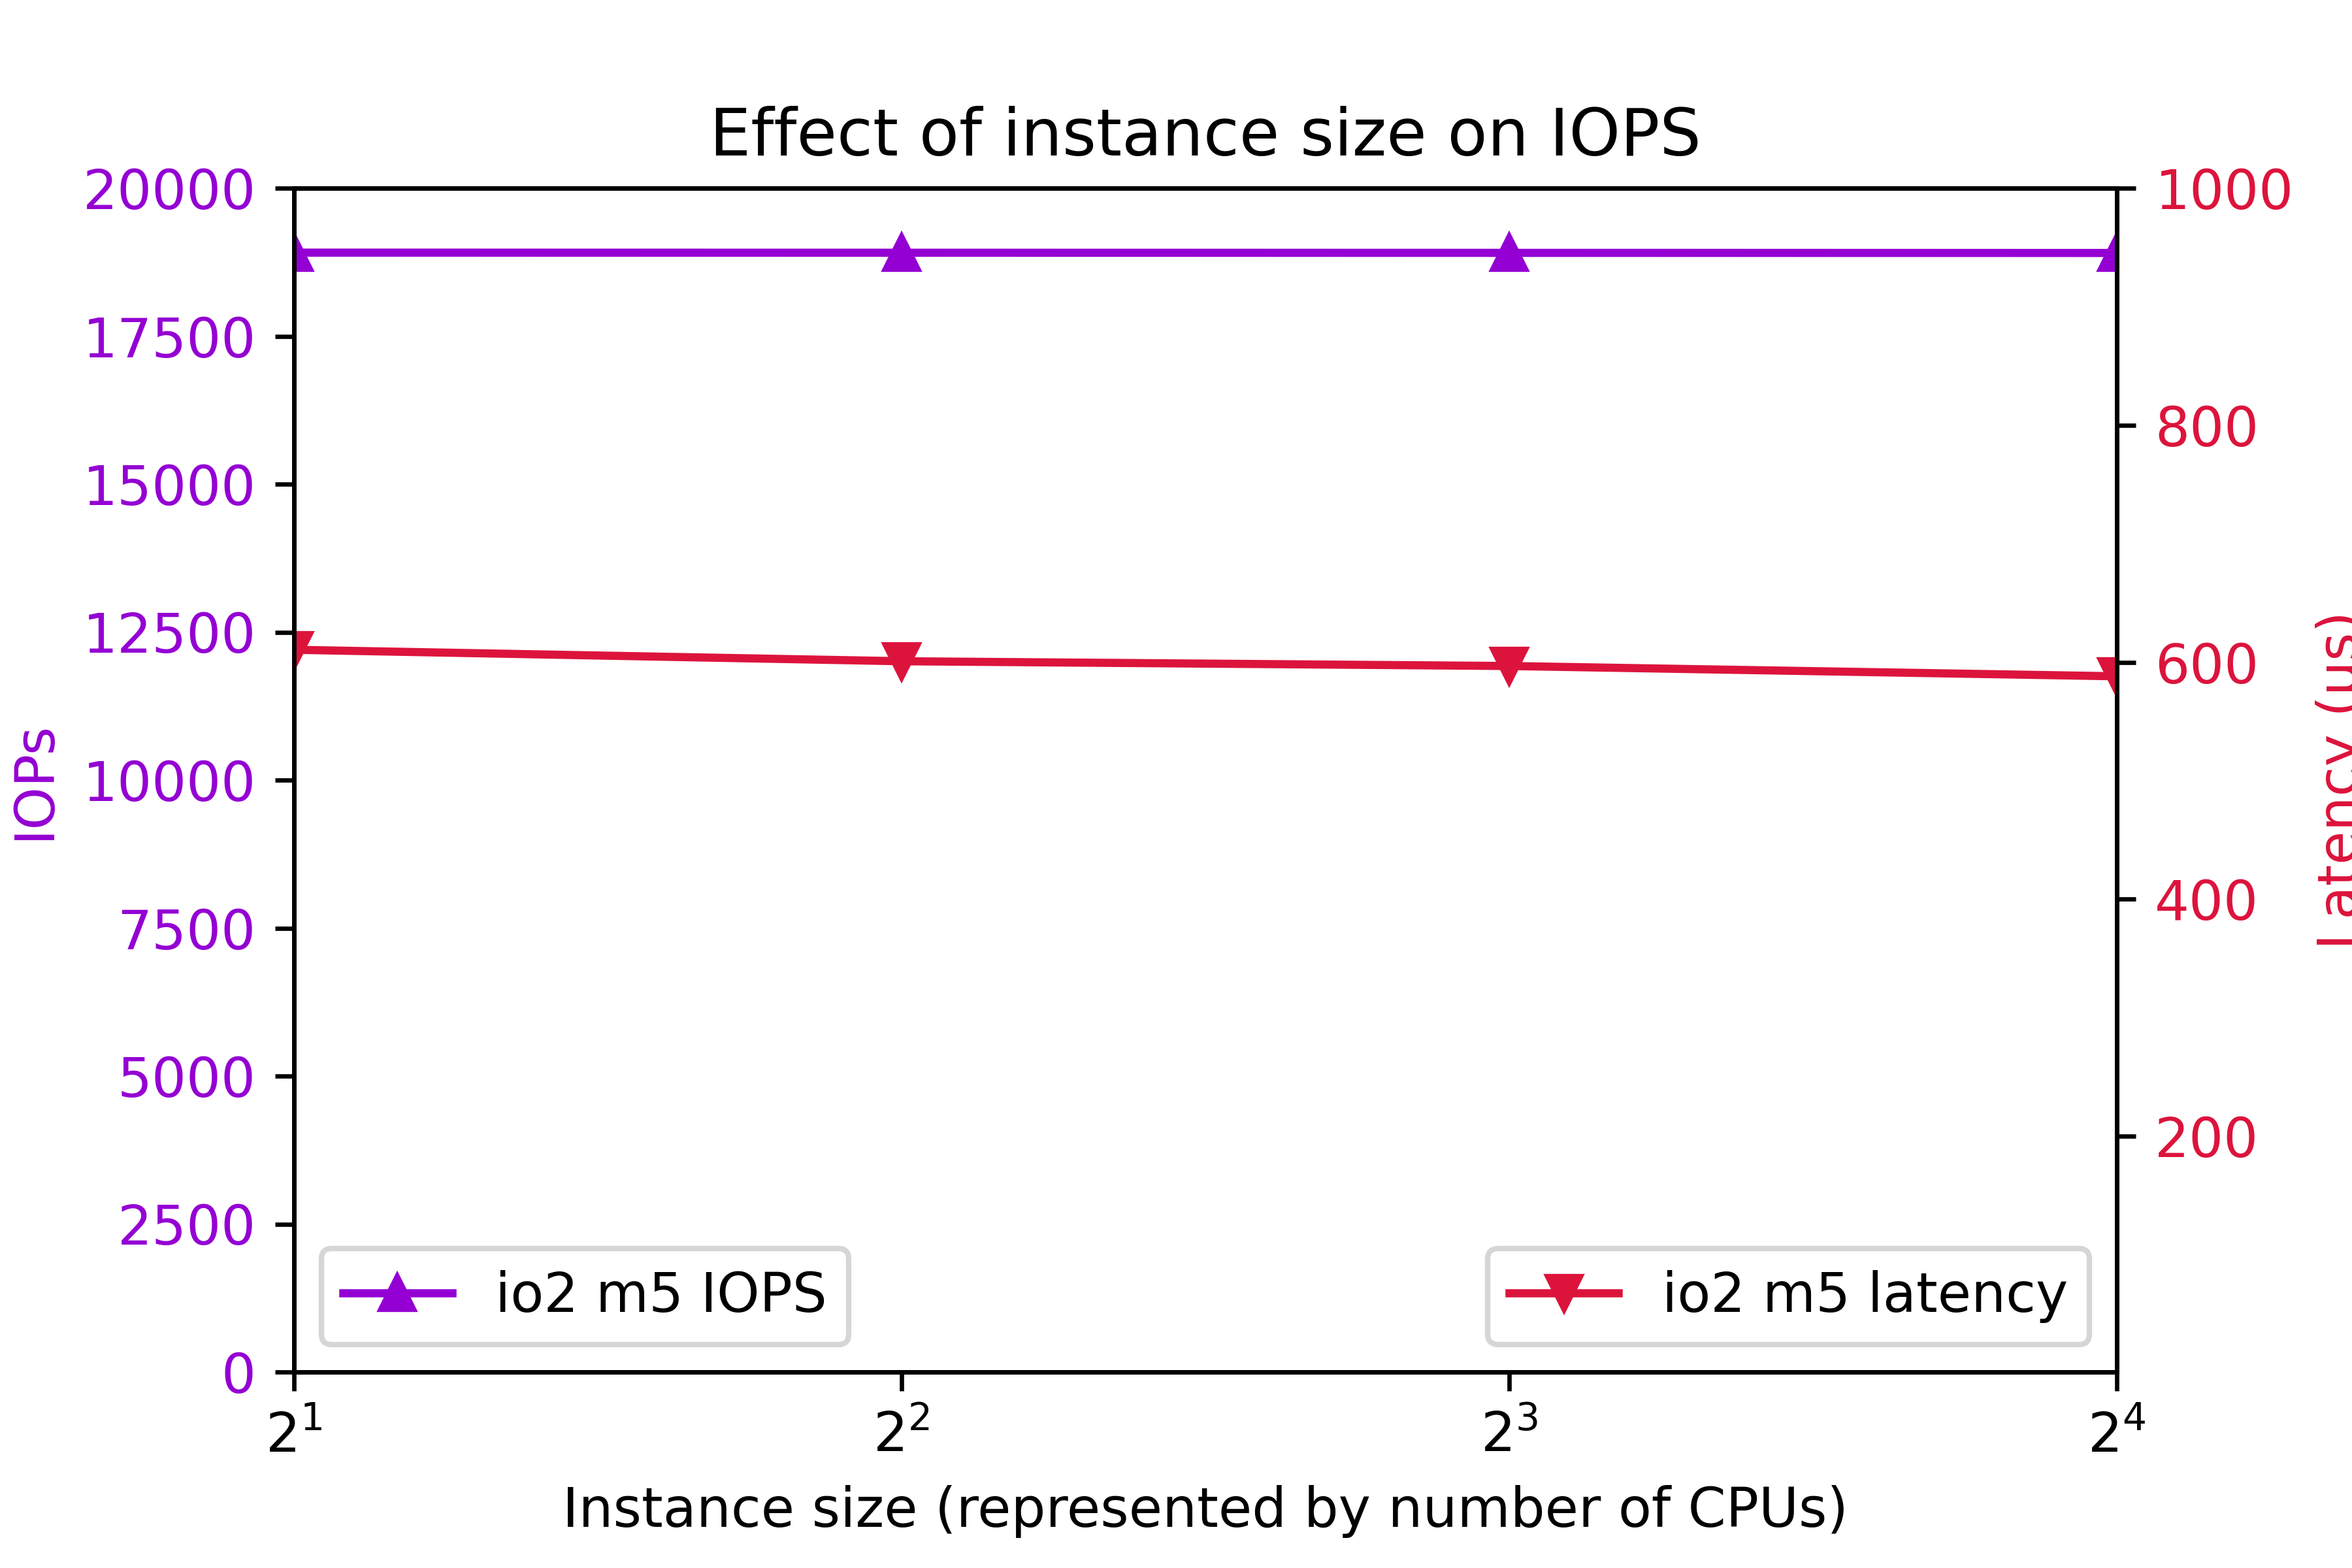
Again, to clarify, configured IOPS for each volume was 7000. You might think that configuring 8 volumes are 7000 IOPS per volume should deliver 56000 IOPS. As you can see, actual IOPS is less.

The key IOPS testing observations are:

  • IOPs is flat at 18905.
  • Latency is flat at 600ms.

Conclusion

  • r5b throughput outperforms m5 by better than 3x.
  • I/O performance is level up to 4xlarge.
  • Starting at 8xlarge, throughput ramps up with instance class.
  • 24xlarge delivers the highest throughput.
  • t3 write throughput lags m5, and m4 write throughput lags t3.
  • The observed system I/O rate is much less than you would expect if you calculated I/O rate based on the volume configuration.

This section was an overview of the capabilities of various EC2 instance types and volume types with eight volumes. As we are about to see, tuning the number of volumes is crucial to optimizing instance performance.

Number of volumes

The influence of the number of volumes on I/O was tested for various instance types. The number of volumes ranged from 1 to 16. Throughput was tested on general purpose volume types gp2 and gp3. The gp3 storage was configured for 1000 Mbps and 4000 IOPs per volume. The results are shown in the following figure:Additionally, IOPS was measured on on I/O optimized volume type io2. IOPS was set at 7000 per volume. The results are shows here:The key findings are

  • For improved throughput, I/O should be distributed across multiple volumes.
  • In r5b.24xlarge, throughput increases all the way out to 7300 Mbps at 16 volumes.
  • In r5b8xlarge and m5.24xlarge, throughput levels off around 2400 Mbps at 8 volumes.
  • On m5.large, gp2 and gp3 throughput levels off at 580 Mbps at four volumes.
  • On m5.large, io2 IOPs plateaus at 18905 IOPs at four volumes.
  • io2 latency tends to remain below 625ms.

Be aware that the EC2 device attachment limit is 28, including the network adapter and up to 27 volumes, including the system disk. A practical Oracle ASM system could consist of two diskgroups and four or more disks per group.

In conclusion, one can expect improve I/O by implementing four volumes. In high end systems, configuring eight or more volumes is beneficial. Exercise prudence on the number of volumes, because throughput and IOPS charges are per-volume.

Configured volume throughput

So far, we have tested volumes that are over-provisioned, meaning that measured throughput turned out to be much less than rated throughput. You don’t get what you pay for. So how much throughput should you actually be configuring?

In this section, we investigate the effect of configured throughput versus actual throughput on gp3 volumes. gp3 volumes were configured at 3000 IOPs and a throughput range from 125 Mbps to 1000 Mbps. Various m5 and r5b instance types were tested. The results are shown here.In the m5.large, m5.24xlarge, and r5b.8xlarge cases, setting volume throughput to 375 Mbps achieves the maximum possible system throughput. Setting volume throughput higher than that leads to no further gains in performance. In r5b.12xlarge and r5b.24xlarge, performance can be maximized by setting throughput to 500 Mbps. In conclusion, although gp3 throughput can be adjusted to 1000 Mbps, there is no benefit to setting gp3 throughput above 500 Mbps, and only in rare cases is it beneficial to set gp3 throughput above 375 Mbps.

Intel vs. AMD

AWS offers a choice of Intel or AMD processor on Red Hat EC2. AMD EC2 prices are 10% lower than Intel. Rated EBS throughput on the AMD systems is less than on Intel.

AMD
Intel
instance type throughput (Mbps) instance type throughput (Mbps)
t3a.medium t3.medium
m5a.large 2880 m5.large 4750
m5a.24xlarge 13570 m5.24xlarge 19000

The test system configurations were:

Instance type CPUs Volumes Storage Throughput IOPS
t3[a].medium 2 4 st1
m5[a].large 2 8 gp3 375 3000
m5[a].24xlarge 96 8 gp3 375 3000

“t3[a].medium” refers to a comparison of a t3a.medium (AMD) system to a t3.medium (Intel) system, and so on, for m5[a].large and m5[a].24xlarge.At the low end instance types, AMD and Intel performed equally. At the high end, Intel edged AMD.

Systems for different purposes

Recommendations for three different type of systems are presented here. The target system is Oracle Database on top of Grid Infrastructure on Red Hat. Only systems with at least 2 CPUs and 4 GB RAM are considered. A “system” could refer to an ASM diskgroup, such as DATA, RECO, or REDO.

Low cost

You might need a low cost system for light development, well-tuned reports, archiving, etc. Use the t3a instance class and st1 storage.

General purpose

For general purpose production systems, use the m5 class. If you want to halve the memory, substitute c5 and save 9% to 11%. To double the system memory, use r5 and pay 24% to 30% more. Configure four or more gp3 volumes per ASM diskgroup at 125 Mbps to 375 Mbps throughput and 3000 IOPS.

High throughput

For highest large write throughput on EBS, use r5b.24xlarge, and at 16 gp3 volumes configured at 500 Mbps.

Example systems and cost

Example of the three types of system are presented in this table. This time, we present CPU and storage cost, assuming Red Hat Linux and on demand pricing in region us-east-1, as of 7/24/2021.

Purpose Instance Type Vol type Num CPU Vol Size Num Vols Thr IOPS Actual Mbps EC2 EBS Total
Low cost t3a.medium st1 2 125 8 245 $71 $45 $116
General purpose m5.large gp3 2 250 4 125 3000 497 $114 $80 $194
High throughput r5b.24xlarge gp3 96 1000 16 500 3000 7330 $5316 $1522 $6838

Do not waste money

Follow this guidance to avoid wasting money

  • Avoid io2 EBS for general purpose Oracle databases. The cost is prohibitive.
  • In gp3, configure throughput at 500 Mbps or less, and configure 3000 IOPS.
  • For good, economical performance, configure gp3 at 125 Mbps and 3000 IOPS.

Workload

This article offers guidance on configuring the AWS EBS at 100% write. The findings apply to any diskgroup, particularly to redo diskgroups and to databases with high throughput requirements, such as ETL systems. The information is among many factors to consider when specifying a practical database system. Orion is also capable of simulating a 100% read workload, and a mixed workload. Mixed workload Orion results could be used to look for further cost reductions. Actual database application performance depends not only on storage throughput, but also on processor design, amount and speed of memory, and table design.

ASM diskgroup layout

Oracle makes ASM diskgroup layout recommendations: RAC and Oracle Clusterware Best Practices and Starter Kit (Platform Independent) (Doc ID 810394.1).

Oracle recommends a minimum 4 disks per diskgroup:My own test results show that a minimum of 4 LUNs per diskgroup lead to optimal throughput. Configuring 4 or more LUNs per diskgroup is extremely important.

Oracle recommends no more than 2 ASM diskgroups:Benefits of no more than 2 ASM diskgroups:

  • Simplified administration.
  • High throughput in all diskgroups.
  • Avoid approaching the EC2 attachment limit.

If you configure more than 2 diskgroups, you could find yourself making design compromises at exactly the wrong places. For example, online redo logs are critical, high throughput components. If you configure separate REDO diskgroups in EC2, then you may find it difficult to keep to 4 disks per diskgroup, and still allow for expansion and remain within the attachment limit. Or you may find that so many diskgroups leads to a manageability issue.

Conclusion

The r5b instance class with gp3 storage delivers the highest performing I/O. m5, c5, and r5 instance classes make well-performing, general purpose systems with high throughput. The t3a instance class with st1 storage makes a fair-performing, low cost system. Each ASM disk groups should be configured with a minimum of 4 disks and more than 4 disks for high throughput r5b systems. For optimal throughput, gp3 EBS should be configured at 3000 IOPS and no more than 500 Mbps.

DGMGRL not required in listener.ora in Restart

By Brian Fitzgerald

Introduction

In Oracle Restart, _DGMGRL services are no longer required in listener.ora. Switchover output has changed slightly and _DGMGRL connections no longer appear in the listener log.

Background

While testing switchover in Data Guard in 19c, I noticed that after configuring Restart, connections to _DGMGRL longer appeared in the listener log. I deleted the _DGMGRL services, reloaded the listeners, and retested the switchover without issue.

Static listeners (initial)

Initially, in the grid account, in $ORACLE_HOME/network/admin/listener.ora, these SID_LIST_LISTENER were in place. At the primary:

SID_LIST_LISTENER =
  (SID_LIST =
    (SID_DESC =
      (GLOBAL_DBNAME = NY_DGMGRL)
      (ORACLE_HOME = /u01/app/oracle/product/19.3.0/dbhome_1)
      (SID_NAME = ORCL)
    )
  )

At the far sync:

SID_LIST_LISTENER =
  (SID_LIST =
    (SID_DESC =
      (GLOBAL_DBNAME = FS_DGMGRL)
      (ORACLE_HOME = /u01/app/oracle/product/19.3.0/dbhome_1)
      (SID_NAME = ORCL)
    )
  )

At the standby:

SID_LIST_LISTENER =
  (SID_LIST =
    (SID_DESC =
      (GLOBAL_DBNAME = SF_DGMGRL)
      (ORACLE_HOME = /u01/app/oracle/product/19.3.0/dbhome_1)
      (SID_NAME = ORCL)
    )
  )

I reloaded the listeners at each host:

[grid@ip-172-31-86-22 ~]$ lsnrctl reload

LSNRCTL for Linux: Version 19.0.0.0.0 - Production on 02-SEP-2019 12:28:09

Copyright (c) 1991, 2019, Oracle. All rights reserved.

Connecting to (DESCRIPTION=(ADDRESS=(PROTOCOL=TCP)(HOST=ip-172-31-86-22.ec2.internal)(PORT=1521)))
The command completed successfully

Switchover test before setting up Restart

The following switchover test without Restart was done:

DGMGRL> switchover to SF
Performing switchover NOW, please wait...
Operation requires a connection to database "SF"
Connecting ...
Connected to "SF"
Connected as SYSDBA.
New primary database "SF" is opening...
Operation requires start up of instance "ORCL" on database "NY"
Starting instance "ORCL"...
Connected to an idle instance.
ORACLE instance started.
Connected to "NY"
Database mounted.
Connected to "NY"
Switchover succeeded, new primary is "sf"

Notice the message ‘Operation requires start up of instance “ORCL” on database “NY”‘. In the NY listener log, several connections to service NY_DGMGRL appear. For example:

02-SEP-2019 22:46:10 * (CONNECT_DATA=(SERVICE_NAME=NY_DGMGRL)(INSTANCE_NAME=ORCL)(SERVER=DEDICATED)(CID=(PROGRAM=dgmgrl)(HOST=ip-172-31-86-22.ec2.internal)(USER=oracle))) * (ADDRESS=(PROTOCOL=tcp)(HOST=172.31.86.22)(PORT=51298)) * establish * NY_DGMGRL * 0

Run “show configuration”:

DGMGRL> show configuration

Configuration - ORCL_CONFIG

  Protection Mode: MaxPerformance
  Members:
  SF - Primary database
    FS - Far sync instance
      NY - Physical standby database

Fast-Start Failover:  Disabled

Configuration Status:
SUCCESS   (status updated 51 seconds ago)

Switch back to the original primary.

DGMGRL> switchover to NY
Performing switchover NOW, please wait...
New primary database "NY" is opening...
Operation requires start up of instance "ORCL" on database "SF"
Starting instance "ORCL"...
Connected to an idle instance.
ORACLE instance started.
Connected to "SF"
Database mounted.
Connected to "SF"
Switchover succeeded, new primary is "ny"

Notice the message ‘Operation requires start up of instance “ORCL” on database “SF”‘ . In the SF listener log, several connections to service SF_DGMGRL appear. For example:

02-SEP-2019 22:43:08 * (CONNECT_DATA=(SERVICE_NAME=SF_DGMGRL)(INSTANCE_NAME=ORCL)(SERVER=DEDICATED)(CID=(PROGRAM=dgmgrl)(HOST=ip-172-31-86-22.ec2.internal)(USER=oracle))) * (ADDRESS=(PROTOCOL=tcp)(HOST=172.31.86.22)(PORT=50340)) * establish * SF_DGMGRL * 0

Notice already at the far sync, no connections to the FS_DGMGRL service appeared. Service FS_DGMGRL plays no role at the far sync.

Configure Restart

Register your Restart instances.

At the primary:

[oracle@ip-172-31-86-22 ~]$ srvctl add database -database NY -role PRIMARY -stopoption IMMEDIATE -instance ORCL -oraclehome /u01/app/oracle/product/19.3.0/dbhome_1 -spfile +DATA01/ORCL/PARAMETERFILE/spfile.266.1017440879 -diskgroup DATA01,RECO01

At the far sync:

[oracle@ip-172-31-28-23 ~]$ srvctl add database -database FS -role physical_standby -startoption MOUNT -stopoption ABORT -instance ORCL -oraclehome /u01/app/oracle/product/19.3.0/dbhome_1 -spfile /u01/app/oracle/product/19.3.0/dbhome_1/dbs/spfileORCL.ora -diskgroup DATA01,RECO01

To activate the change, I found it necessary to issue srvctl start. That does not seem right. “srvctl enable database” should do it.

Also, in Restart, “srvctl enable instance” is not available. “srvctl enable instance” only works in RAC.

Unless you activate the instance, it will not start automatically upon host reboot.

[oracle@ip-172-31-28-23 ~]$ srvctl start database -database FS

At the standby:

[oracle@ip-172-32-10-34 ~]$ srvctl add database -database SF -role physical_standby -startoption MOUNT -stopoption ABORT -instance ORCL -oraclehome /u01/app/oracle/product/19.3.0/dbhome_1 -spfile /u01/app/oracle/product/19.3.0/dbhome_1/dbs/spfileORCL.ora -diskgroup DATA01,RECO01
[oracle@ip-172-32-10-34 ~]$ srvctl start database -database SF

Reboot all hosts and check that the database instances start automatically, in the proper startup mode and Data Guard role.

Switchover test

Test switchover to SF. The output changes slightly, and becomes:

DGMGRL> switchover to SF
Performing switchover NOW, please wait...
Operation requires a connection to database "SF"
Connecting ...
Connected to "SF"
Connected as SYSDBA.
New primary database "SF" is opening...
Oracle Clusterware is restarting database "NY" ...
Connected to an idle instance.
Connected to "NY"
Connected to "NY"
Switchover succeeded, new primary is "sf"

After configuring Restart, the Data Guard switchover output has changed slightly. Message ‘Operation requires start up of instance “ORCL” on database “NY”‘ has been replaced with ‘Oracle Clusterware is restarting database “NY” …’. A review of the NY listener log shows no connection to service NY_DGMGRL.

Test switchover to NY. The output is now:

DGMGRL> switchover to NY
Performing switchover NOW, please wait...
New primary database "NY" is opening...
Oracle Clusterware is restarting database "SF" ...
Connected to an idle instance.
Connected to "SF"
Connected to "SF"
Switchover succeeded, new primary is "ny"

A review of the SF listener log shows no connection to service SF_DGMGRL.

Static listeners (final)

In Restart, therefore, the “_DGMGRL” listener.ora entry is not needed. SID_LIST_LISTENER can be simplified on the primary, far sync, and standby as:

SID_LIST_LISTENER =
  (SID_LIST =
    (SID_DESC =
      (ORACLE_HOME = /u01/app/oracle/product/19.3.0/dbhome_1)
      (SID_NAME = ORCL)
    )
  )

After configuring Oracle Restart, switchovers were retested with the revised listener.ora without issue.

Error in non-Restart and no DGMGRL

Suppose we disable restart at NY.

[oracle@ip-172-31-86-22 ~]$ srvctl stop database -database NY
[oracle@ip-172-31-86-22 ~]$ srvctl remove database -database NY -y
[oracle@ip-172-31-86-22 dbs]$ cat > initORCL.ora
spfile='+DATA01/NY/PARAMETERFILE/spfile.263.1018152951'
[oracle@ip-172-31-86-22 dbs]$ sysdba

SQL*Plus: Release 19.0.0.0.0 - Production on Thu Sep 12 11:07:20 2019
Version 19.3.0.0.0

Copyright (c) 1982, 2019, Oracle.  All rights reserved.

Connected to an idle instance.

SQL> startup
ORACLE instance started.

Total System Global Area 1140849904 bytes
Fixed Size                  8895728 bytes
Variable Size             318767104 bytes
Database Buffers          805306368 bytes
Redo Buffers                7880704 bytes
Database mounted.
Database opened.

DGMGRL> show configuration

Configuration - ORCL_CONFIG

  Protection Mode: MaxAvailability
  Members:
  NY - Primary database
    SF - Physical standby database

Fast-Start Failover:  Disabled

Configuration Status:
SUCCESS   (status updated 11 seconds ago)

(Note: In this example, there is no far sync.) Now try a switchover:

DGMGRL> switchover to SF
Performing switchover NOW, please wait...
Operation requires a connection to database "SF"
Connecting ...
Connected to "SF"
Connected as SYSDBA.
New primary database "SF" is opening...
Operation requires start up of instance "ORCL" on database "NY"
Starting instance "ORCL"...
Unable to connect to database using (DESCRIPTION=(ADDRESS=(PROTOCOL=TCP)(HOST=ip-172-31-86-22.ec2.internal)(PORT=1521))(CONNECT_DATA=(SERVICE_NAME=NY_DGMGRL)(INSTANCE_NAME=ORCL)(SERVER=DEDICATED)))
ORA-12514: TNS:listener does not currently know of service requested in connect descriptor

Failed.

Please complete the following steps to finish switchover:
        start up and mount instance "ORCL" of database "NY"

The new primary, SF, opens just fine. The old primary, NY, got shut down, but now there is no way for the broker to restart it. The listener is not listening on behalf of the oracle database.

[grid@ip-172-31-86-22 ~]$ lsnrctl status

LSNRCTL for Linux: Version 19.0.0.0.0 - Production on 12-SEP-2019 11:26:00

Copyright (c) 1991, 2019, Oracle.  All rights reserved.

Connecting to (DESCRIPTION=(ADDRESS=(PROTOCOL=TCP)(HOST=ip-172-31-86-22.ec2.internal)(PORT=1521)))
STATUS of the LISTENER
------------------------
Alias                     LISTENER
Version                   TNSLSNR for Linux: Version 19.0.0.0.0 - Production
Start Date                12-SEP-2019 10:15:24
Uptime                    0 days 1 hr. 10 min. 36 sec
Trace Level               off
Security                  ON: Local OS Authentication
SNMP                      OFF
Listener Parameter File   /u01/app/19.3.0/grid/network/admin/listener.ora
Listener Log File         /u01/app/grid/diag/tnslsnr/ip-172-31-86-22/listener/alert/log.xml
Listening Endpoints Summary...
  (DESCRIPTION=(ADDRESS=(PROTOCOL=tcp)(HOST=ip-172-31-86-22.ec2.internal)(PORT=1521)))
  (DESCRIPTION=(ADDRESS=(PROTOCOL=ipc)(KEY=EXTPROC1521)))
Services Summary...
Service "+ASM" has 1 instance(s).
  Instance "+ASM", status READY, has 1 handler(s) for this service...
Service "+ASM_DATA01" has 1 instance(s).
  Instance "+ASM", status READY, has 1 handler(s) for this service...
Service "+ASM_RECO01" has 1 instance(s).
  Instance "+ASM", status READY, has 1 handler(s) for this service...
The command completed successfully

This error referring to misssing service NY_DGMGRL appears in the listener log:

12-SEP-2019 11:22:09 * (CONNECT_DATA=(SERVICE_NAME=NY_DGMGRL)(INSTANCE_NAME=ORCL)(SERVER=DEDICATED)(CID=(PROGRAM=dgmgrl)(HOST=ip-172-31-86-22.ec2.internal)(USER=oracle))) * (ADDRESS=(PROTOCOL=tcp)(HOST=172.31.86.22)(PORT=53930)) * establish * NY_DGMGRL * 12514
TNS-12514: TNS:listener does not currently know of service requested in connect descriptor

The conclusion is that without Restart we need the static listener and the DGMGRL in SID_LIST_LISTENER.

Validate static listeners

Validating the static listeners is a critical Data Guard setup step. After duplicating the database and setting up Restart, check each static listener.:

  • Connect over the network with sqlplus
  • Shutdown (shutdown abort for standbys and far syncs)
  • Startup (startup mount for standbys and far syncs)

Example:

[oracle@ip-172-31-28-23 ops]$ sqlplus sys/zystm.22@FS as sysdba

SQL*Plus: Release 19.0.0.0.0 - Production on Fri Sep 13 11:36:37 2019
Version 19.3.0.0.0

Copyright (c) 1982, 2019, Oracle.  All rights reserved.


Connected to:
Oracle Database 19c Enterprise Edition Release 19.0.0.0.0 - Production
Version 19.3.0.0.0

SQL> shutdown abort
ORACLE instance shut down.
SQL> startup mount
ORACLE instance started.

Total System Global Area 1140849904 bytes
Fixed Size                  8895728 bytes
Variable Size             301989888 bytes
Database Buffers          822083584 bytes
Redo Buffers                7880704 bytes
Database mounted.

This is an example of a failed static listener check.

[oracle@ip-172-31-28-23 ops]$ sqlplus sys/zystm.22@FS as sysdba

SQL*Plus: Release 19.0.0.0.0 - Production on Fri Sep 13 11:36:37 2019
Version 19.3.0.0.0

Copyright (c) 1982, 2019, Oracle.  All rights reserved.


Connected to:
Oracle Database 19c Enterprise Edition Release 19.0.0.0.0 - Production
Version 19.3.0.0.0

SQL> shutdown abort
ORACLE instance shut down.
SQL> startup mount
ORACLE instance started.

Total System Global Area 1140849904 bytes
Fixed Size                  8895728 bytes
Variable Size             301989888 bytes
Database Buffers          822083584 bytes
Redo Buffers                7880704 bytes
Database mounted.
SQL> shutdown abort
ORACLE instance shut down.
ERROR:
ORA-12505: TNS:listener does not currently know of SID given in connect
descriptor


SQL> startup mount
SP2-0640: Not connected

Resolve all failures before proceeding.

Conclusion

In Oracle Database 12.1, the Data Guard Broker Manager tool (dgmgrl) was modified so that in Restart or RAC, “_DGMGRL” is no longer required. This fact is mentioned in Oracle Data Guard Broker and Static Service Registration (Doc ID 1387859.1).

On the other hand, if you are not using Restart, then you do need DGMGRL in your SID_LIST_LISTENER.

Restart is only available with Grid Infrastructure. The main benefit of Grid Infrastructure is ASM. If you built Oracle Database on operating system files, then you have less of a need for Grid Infrastructure. If you did not install Grid Infrastructure, then Restart is not available. Without Retstart, a Data Guard setup will need a DGMGRL service in SID_LIST_LISTENER.

During Data Guard setup, validate all static listeners.

Symmetric far sync Data Guard

Introduction

Presented here is a reliable, symmetric Oracle Data Guard network. By reliable is meant that zero data loss and continuous availability is guaranteed in case of loss of one far sync. Symmetric means that there is is no preferred primary site.

Background

I used to drive a Navy Nuclear Submarine. On a weekly basis, we switched over our running machinery. For example, we switched over our turbine generator lubricating oil pumps. The engineroom upper level watch would the start the standby pump, verify proper response, and then and place the originally running pump in standby. We shifted our pumps for multiple reasons. Switching pumps equalized wear. It also verified readiness and operability. Finally, by operating the controls on a regular basis, the crew maintained a higher level of proficiency.

Notice a few things about this arrangement. No pump is a “preferred” primary. The pump functioning in the standby role is in no way inferior in design, specifications, or readiness. Because the machinery is rotated on a weekly basis, there is no question that the standby is ready to take over the primary role immediately when necessary.

So it is with databases. You need to have  a disaster recovery strategy. The DR site needs to be in a known state of readiness at all times. The best way of accomplishing that is to rotate DR sites on a weekly or quarterly basis. No site is a “preferred” primary. By regularly exercising the system, there is no question that a standby is in a state of readiness. Finally, database administrators maintain proficiency by regularly switching over the Data Guard systems.

A reliable, symmetric Data Guard arrangement is convenient to set up in the cloud. You have complete flexibility over which region and availability zone for placing your databases and far syncs.

Environment

The environment is Amazon AWS EC2 (Elastic Computing Cloud) with Red Hat Linux 7.2. Here is an overview of the environment.

db unique name region availability zone type net I/O sync latency from latency μs
NY us-east-1 us-east-1c database SYNC SF 32000
NY_FSA us-east-1 us-east-1d far sync ASYNC NY 250
NY_FSB us-east-1 us-east-1a far sync ASYNC NY 500
SF us-west-1 us-west-1b database SYNC NY 31500
SF_FSA us-west-1 us-west-1b far sync ASYNC SF 115
SF_FSB us-west-1 us-west-1c far sync ASYNC SF 600

Notice that NY, NY_FSA, and NY_FSB are in the same region but in separate availability zones. Also, SF, SF_FSA, and SF_FSB are in the same region but SF_FSB is in an availability zone separate from SF and SF_FSA. SF and SF_FSA are in the same availability zone. The highest latency is across regions. The lowest latency is within one availability zone. Medium latency is in the same region but across availability zones.

Here is a network diagram.

reliable.symmetric

In Maximum Availability mode, the primary ships redo to one far sync, leaving the second far sync as an alternate. In fase of a failure on the far sync, the alternate comes on line, resyncs with the primary, and takes over the role of far sync. The primary always ships redo to a far sync in the same region. For example, NY ships to NY_FSA or NY_FSB. Because of this arrangement, there is a total of four far syncs, two per region. Although four far sync hosts are required, the hosts could be configured with less CPU, memory, and disk space than the primary database. In a cloud, CPU, memory, and disk can be reconfigured quickly. Note that in the present symmmetric arrangement, far sync direction is one-way, from the local database to the database in the remote region.

Setup

You can assume an initial, enabled Maximum Availability configuration with only a primary and standby database, and no far syncs.

Create and enable the far syncs

Create far syncs as explained in Data Guard 19c in AWS with far sync. Add the far syncs and enable them.

DGMGRL> add far_sync "NY_FSA" as connect identifier is 'NY_FSA';
far sync instance "NY_FSA" added
DGMGRL> enable far_sync "NY_FSA";
Enabled.
DGMGRL> add far_sync 'NY_FSB' as connect identifier is 'NY_FSB';
far sync instance "NY_FSB" added
DGMGRL> enable far_sync 'NY_FSB'
Enabled.
DGMGRL> add far_sync 'SF_FSA' as connect identifier is 'SF_FSA';
far sync instance "SF_FSA" added
DGMGRL> enable far_sync 'SF_FSA';
Enabled.
DGMGRL> add far_sync 'SF_FSB' as connect identifier is 'SF_FSB';
far sync instance "SF_FSB" added
DGMGRL> enable far_sync 'SF_FSB'
Enabled.

The configuration so far looks like this:

DGMGRL> show configuration

Configuration - ORCL_CONFIG

  Protection Mode: MaxAvailability
  Members:
  NY     - Primary database
    SF     - Physical standby database

  Members Not Receiving Redo:
  NY_FSA - Far sync instance
  SF_FSA - Far sync instance
  SF_FSB - Far sync instance
  NY_FSB - Far sync instance

Fast-Start Failover:  Disabled

Configuration Status:
SUCCESS   (status updated 57 seconds ago)

Edit the far sync routes

DGMGRL> edit far_sync NY_FSA set property RedoRoutes = '(NY : SF ASYNC)';
Property "redoroutes" updated
DGMGRL> edit far_sync NY_FSB set property RedoRoutes = '(NY : SF ASYNC)';
Property "redoroutes" updated
DGMGRL> edit far_sync SF_FSA set property RedoRoutes = '(SF : NY ASYNC)';
Property "redoroutes" updated
DGMGRL> edit far_sync SF_FSB set property RedoRoutes = '(SF : NY ASYNC)';
Property "redoroutes" updated

Edit the database routes

DGMGRL> edit database NY set property RedoRoutes = '(LOCAL : (NY_FSA SYNC, NY_FSB SYNC))';
Property "redoroutes" updated
DGMGRL> edit database SF set property RedoRoutes = '(LOCAL : (SF_FSA SYNC, SF_FSB SYNC))';
Property "redoroutes" updated
DGMGRL> show configuration

Configuration - ORCL_CONFIG

  Protection Mode: MaxAvailability
  Members:
  NY     - Primary database
    NY_FSA - Far sync instance
      SF     - Physical standby database

  Members Not Receiving Redo:
  SF_FSA - Far sync instance
  SF_FSB - Far sync instance
  NY_FSB - Far sync instance (alternate of NY_FSA)

Fast-Start Failover:  Disabled

Configuration Status:
SUCCESS   (status updated 40 seconds ago)

Test far sync failover

In case of a failure of the far sync, Data Guard should quickly switch over to the alternate far sync. In this example, if there is a disrpution of NY_FSA, Data Guard should fail over to NY_FSB. We want to observe the system response to a simulated failure at NY_FSA. There are two failure scenarios.

end-of-file on communication channel

In a TCP client, such as the primary database connection to the far sync, ORA-03113: end-of-file on communication channel will appear when the far sync is disrupted but the far sync host is still on the network. Possible causes could include far sync instance crash, restart, or host reboot. As long as the host is on the network at the link level, it is possible for the primary host operating system to quickly identify the error and return a failure to the primary database. In such cases, an error such as this one appears immediately in the alert log.

2019-09-10T13:44:33.987037-04:00
ORA-03113: end-of-file on communication channel

In such a case, recovery will be very quick. The primary will immediately connect to the alternate far sync. Synchronization can be complete in less than 10 seconds.

timeout error

A timeout will occur if there is a power loss or network disruption. A network disruption could occur as a result of a network configuration change. I can demonstrate a timeout by cutting off the TCP connectivity at the cloud level. To do that, I switch the NY_FSA host to a security group that does not allow traffic on the Oracle port (1521).

clear.sg

In this case, Oracle error detection and recovery is slow. In 30 seconds, the NetTimeout default, the primary connection to NY_FSA (LAD:2 (log archive destination) times out:

2019-09-10T18:22:28.214255-04:00
LGWR (PID:4969): ORA-16198: Received timed out error from KSR
LGWR (PID:4969): Attempting LAD:2 network reconnect (16198)
LGWR (PID:4969): LAD:2 network reconnect abandoned
2019-09-10T18:22:28.214836-04:00
Errors in file /u01/app/oracle/diag/rdbms/ny/ORCL/trace/ORCL_lgwr_4969.trc:
ORA-16198: Timeout incurred on internal channel during remote archival
LGWR (PID:4969): Error 16198 for LNO:1 to 'NY_FSA'
2019-09-10T18:22:28.223786-04:00
LGWR (PID:4969): LAD:2 is UNSYNCHRONIZED
LGWR (PID:4969): Failed to archive LNO:1 T-1.S-333, error=16198

After another 30 seconds, the primary gives up on NY_FSA and switches to NY_FSB (LAD:3).

2019-09-10T18:22:58.232029-04:00
LGWR (PID:4969): ORA-16198: Received timed out error from KSR
LGWR (PID:4969): Error 16198 disconnecting from LAD:2 standby host 'NY_FSA'
2019-09-10T18:22:58.232531-04:00
LGWR (PID:4969): LAD:3 is UNSYNCHRONIZED
2019-09-10T18:22:58.232638-04:00
LGWR (PID:4969): LAD:2 no longer supports SYNCHRONIZATION
LGWR (PID:4969): SRL selected to archive T-1.S-334
LGWR (PID:4969): SRL selected for T-1.S-334 for LAD:3
2019-09-10T18:22:58.449325-04:00
Thread 1 advanced to log sequence 334 (LGWR switch)
  Current log# 2 seq# 334 mem# 0: +RECO01/NY/ONLINELOG/group_2.484.1018151803
  Current log# 2 seq# 334 mem# 1: +DATA01/NY/ONLINELOG/group_2.270.1018151815
2019-09-10T18:22:58.519853-04:00
ARC0 (PID:5073): Archived Log entry 675 added for T-1.S-333 ID 0x5c2b52e5 LAD:1
2019-09-10T18:22:58.707980-04:00
ARC1 (PID:5079): SRL selected for T-1.S-333 for LAD:3

Synchronization begins, but four to five minutes elapse until the primary is resynced to the new far sync, NY_FSB.

2019-09-10T18:27:01.888256-04:00
LGWR (PID:4969): LAD:3 is SYNCHRONIZED

While NY_FSB is synchronizing, there are two things to notice. The primary status is:

  NY     - Primary database
    Warning: ORA-16629: database reports a different protection level from the protection mode

and the protection level:

SQL> select protection_level from v$database;

PROTECTION_LEVEL
--------------------
RESYNCHRONIZATION

The final state is:

DGMGRL> show configuration

Configuration - ORCL_CONFIG

  Protection Mode: MaxAvailability
  Members:
  NY     - Primary database
    NY_FSB - Far sync instance (alternate of NY_FSA)
      SF     - Physical standby database

  Members Not Receiving Redo:
  NY_FSA - Far sync instance
    Warning: ORA-16857: member disconnected from redo source for longer than specified threshold

  SF_FSA - Far sync instance
  SF_FSB - Far sync instance

Fast-Start Failover:  Disabled

Configuration Status:
WARNING   (status updated 59 seconds ago)

Adjusting NetTimeout

On a low latency and usually reliable network, you should reduce the timeout. Example:

DGMGRL> edit database NY set property NetTimeout = 5;
Property "nettimeout" updated

This makes for a cleaner far sync switchover.

Maximum Protection

You might think that you could implement protection mode Maximum Protection with multiple far syncs:

DGMGRL> edit configuration set protection mode as MaxProtection;

Oracle will not let you do that.

Error: ORA-16627: operation disallowed since no member would remain to support protection mode

If you want to implement Maximum Protection, you will need to implement a direct route to one or more physical standby databases.

Conclusion

Several points were covered in this article.

  • Data Guard latency can be reduced by implementing far sync.
  • Data Guard can be made more reliable by placing multiple far syncs near the primary.
  • Benefits to setting up a symmetric arrangement include:
    • Standby readniness has been recently verified.
    • The standby capability is known to be identical to the primary.
    • Heightened DBA staff proficiency.
  • Setup implementation steps were covered.
  • Data Guard does not keep alternate far syncs in sync with the primary.
  • Data Guard is quick to recover from some error conditions.
  • Data Guard detection and recovery from network timeout can be slow.
  • Maximum Protection though a far sync is not supported.

Data Guard error in Maximum Availability

Introduction

Errors were noted while changing Data Guard protection mode to Maximum Availability. The root cause was mismatched standby redo log size.

Symptoms

We are in protection mode Maximum Performance and we want to set Maximum Availability. Before we begin, we notice something is amiss, but for the sake of discussion, we are not sure what, and we proceed.

DGMGRL> show configuration

Configuration - ORCL_CONFIG

  Protection Mode: MaxPerformance
  Members:
  NY - Primary database
    FS - Far sync instance
      Warning: ORA-16809: multiple warnings detected for the member

      SF - Physical standby database
        Warning: ORA-16809: multiple warnings detected for the member

Fast-Start Failover:  Disabled

Configuration Status:
WARNING   (status updated 57 seconds ago)

We neglect the errors and set protection mode to Maximum Availability.

DGMGRL> edit configuration set protection mode as MaxAvailability;
Succeeded.
DGMGRL> show configuration

Configuration - ORCL_CONFIG

  Protection Mode: MaxAvailability
  Members:
  NY - Primary database
    FS - Far sync instance
      Warning: ORA-16855: transport lag has exceeded specified threshold

      SF - Physical standby database
        Warning: ORA-16809: multiple warnings detected for the member

Fast-Start Failover:  Disabled

Configuration Status:
WARNING   (status updated 59 seconds ago)

The warnings persist. We force a logfile switch at the primary

[oracle@ip-172-31-86-22 ~]$ sqlplus sys/zystm.22@NY as sysdba

SQL*Plus: Release 19.0.0.0.0 - Production on Thu Sep 5 21:16:54 2019
Version 19.3.0.0.0

Copyright (c) 1982, 2019, Oracle.  All rights reserved.


Connected to:
Oracle Database 19c Enterprise Edition Release 19.0.0.0.0 - Production
Version 19.3.0.0.0

SQL> alter system switch logfile;

System altered.

Now errors appear in the show configuration display.

DGMGRL> show configuration

Configuration - ORCL_CONFIG

  Protection Mode: MaxAvailability
  Members:
  NY - Primary database
    Error: ORA-16810: multiple errors or warnings detected for the member

    FS - Far sync instance
      Warning: ORA-16809: multiple warnings detected for the member

      SF - Physical standby database
        Warning: ORA-16809: multiple warnings detected for the member

Fast-Start Failover:  Disabled

Configuration Status:
ERROR   (status updated 51 seconds ago)

The system has errors. Logs are not being processed. We are in hot water. We investigate.

Let’s review the standby and work backward via the far sync, and finally at the primary.

DGMGRL> show database verbose SF StatusReport
STATUS REPORT
       INSTANCE_NAME   SEVERITY ERROR_TEXT
                   *    WARNING ORA-16855: transport lag has exceeded specified threshold
                   *    WARNING ORA-16857: member disconnected from redo source for longer than specified threshold

DGMGRL> show far_sync verbose FS StatusReport
STATUS REPORT
       INSTANCE_NAME   SEVERITY ERROR_TEXT
                   *    WARNING ORA-16855: transport lag has exceeded specified threshold
                   *    WARNING ORA-16857: member disconnected from redo source for longer than specified threshold

DGMGRL> show database NY StatusReport
STATUS REPORT
       INSTANCE_NAME   SEVERITY ERROR_TEXT
                   *    WARNING ORA-16629: database reports a different protection level from the protection mode
                ORCL      ERROR ORA-16737: the redo transport service for member "FS" has an error

Message ‘the redo transport service for member “FS” has an error’ requires further drilldown:

DGMGRL> show database verbose NY LogXptStatus;
LOG TRANSPORT STATUS
PRIMARY_INSTANCE_NAME STANDBY_DATABASE_NAME     STATUS                ERROR
                ORCL                   FS      ERROR ORA-16086: Redo data cannot be written to the standby redo log

The underlying reason is found in far sync RFS trace:

Trace file /u01/app/oracle/diag/rdbms/fs/ORCL/trace/ORCL_rfs_29164.trc
Oracle Database 19c Enterprise Edition Release 19.0.0.0.0 - Production
Version 19.3.0.0.0
Build label:    RDBMS_19.3.0.0.0DBRU_LINUX.X64_190417
ORACLE_HOME:    /u01/app/oracle/product/19.3.0/dbhome_1
System name:    Linux
Node name:      ip-172-31-28-23.ec2.internal
Release:        3.10.0-1062.el7.x86_64
Version:        #1 SMP Thu Jul 18 20:25:13 UTC 2019
Machine:        x86_64
VM name:        Xen Version: 4.2 (HVM)
Instance name: ORCL
Redo thread mounted by this instance: 1
Oracle process number: 56
Unix process pid: 29164, image: oracle@ip-172-31-28-23.ec2.internal


*** 2019-09-04T15:56:40.334571-04:00
*** SESSION ID:(66.28887) 2019-09-04T15:56:40.334605-04:00
*** CLIENT ID:() 2019-09-04T15:56:40.334616-04:00
*** SERVICE NAME:() 2019-09-04T15:56:40.334624-04:00
*** MODULE NAME:(oracle@ip-172-31-86-22.ec2.internal (TNS V1-V3)) 2019-09-04T15:56:40.334631-04:00
*** ACTION NAME:() 2019-09-04T15:56:40.334639-04:00
*** CLIENT DRIVER:() 2019-09-04T15:56:40.334646-04:00

krsv_proc_add: Request to add process to V$MANAGED_STANDBY [krsr.c:4229]
krsr_abrt: The primary database is operating in MAXIMUM PROTECTION
  or MAXIMUM AVAILABILITY mode, and the standby database
  does not contain any viable SRLs
Encountered error status 16086
krsv_proc_rem: Request to remove process from V$MANAGED_STANDBY [krsr.c:12657]

Analysis

Consider the message “the standby database does not contain any viable SRLs” (standby redo logs). By “viable” is meant standby redo logs of size greater than or equal to the primary online redo log. Check the primary online redo log:

SQL> select group#, bytes/1024/1024 mb from v$log;

    GROUP#         MB
---------- ----------
         1        200
         2        200
         3        200

All primary online redo logs are 200 MB. Now check the standby redo logs at each site.

Primary:

SQL> select group#, bytes/1024/1024 mb from v$standby_log;

    GROUP#         MB
---------- ----------
         4         50
         5         50
         6         50
         7         50
         8         50
         9        200

6 rows selected.

Already there is a problem. Not all the standby logs are the same size. Check the far sync:

SQL> select group#, bytes/1024/1024 mb from v$standby_log;

    GROUP#         MB
---------- ----------
         4         50
         5         50
         6         50
         7         50
         8         50

All the standby logs are 50 mb. They are too small. There are no viable standby redo logs. Check the standby:

SQL> select group#, bytes/1024/1024 mb from v$standby_log;

    GROUP#         MB
---------- ----------
         4         50
         5         50
         6         50
         7         50
         8         50

Again, there are no viable SRLs.

Possible root cause

The online redo log size is 200 MB, which happens to be the Database Creation Assistant (DBCA) default size.

For some reason of incorrect administration, the standby redo log size was 50 MB when the database was duplicated. The standby redo log should be 200 MB.

Corrective action

  1. Drop all standby redo logs that are not 200 MB.
  2. Create a set of 200 MB SRLs per database.

Standby database

DGMGRL> edit database SF set state=apply-off;
Succeeded.
SQL> select group#, bytes/1024/1024 mb, status from v$standby_log;

    GROUP#         MB STATUS
---------- ---------- ----------
         4         50 UNASSIGNED
         5         50 UNASSIGNED
         6         50 UNASSIGNED
         7         50 UNASSIGNED
         8         50 UNASSIGNED

SQL> alter system set standby_file_management = manual;

System altered.

SQL> alter database drop logfile group 4;

Database altered.

SQL> alter database drop logfile group 5;

Database altered.

SQL> alter database drop logfile group 6;

Database altered.

SQL> alter database drop logfile group 7;

Database altered.

SQL> alter database drop logfile group 8;

Database altered.

SQL> alter database add standby logfile size 200m;

Database altered.

SQL> alter database add standby logfile size 200m;

Database altered.

SQL> alter database add standby logfile size 200m;

Database altered.

SQL> alter database add standby logfile size 200m;

Database altered.

SQL> alter system set standby_file_management = auto;

System altered.

SQL> select group#, bytes/1024/1024 mb, status from v$standby_log;

    GROUP#         MB STATUS
---------- ---------- ----------
         4        200 UNASSIGNED
         5        200 UNASSIGNED
         6        200 UNASSIGNED
         7        200 UNASSIGNED
DGMGRL> edit database SF set state=apply-on;
Succeeded.

Far sync

SQL> select group#, bytes/1024/1024 mb, status from v$standby_log;

    GROUP#         MB STATUS
---------- ---------- ----------
         4         50 UNASSIGNED
         5         50 UNASSIGNED
         6         50 UNASSIGNED
         7         50 UNASSIGNED
         8         50 UNASSIGNED

SQL> alter database drop logfile group 4;

Database altered.

SQL> alter database drop logfile group 5;

Database altered.

SQL> alter database drop logfile group 6;

Database altered.

SQL> alter database drop logfile group 7;

Database altered.

SQL> alter database drop logfile group 8;

Database altered.

SQL> alter database add standby logfile size 200m;

Database altered.

SQL> alter database add standby logfile size 200m;

Database altered.

SQL> alter database add standby logfile size 200m;

Database altered.

SQL> alter database add standby logfile size 200m;

Database altered.

SQL> select group#, bytes/1024/1024 mb, status from v$standby_log;

    GROUP#         MB STATUS
---------- ---------- ----------
         1        200 UNASSIGNED
         2        200 UNASSIGNED
         3        200 UNASSIGNED
         4        200 UNASSIGNED

Primary

SQL> select group#, bytes/1024/1024 mb, status from v$standby_log;

    GROUP#         MB STATUS
---------- ---------- ----------
         4         50 UNASSIGNED
         5         50 UNASSIGNED
         6         50 UNASSIGNED
         7         50 UNASSIGNED
         8         50 UNASSIGNED
         9        200 UNASSIGNED

6 rows selected.

SQL> alter database drop logfile group 4;

Database altered.

SQL> alter database drop logfile group 5;

Database altered.

SQL> alter database drop logfile group 6;

Database altered.

SQL> alter database drop logfile group 7;

Database altered.

SQL> alter database drop logfile group 8;

Database altered.

SQL> alter database add standby logfile size 200m;

Database altered.

SQL> alter database add standby logfile size 200m;

Database altered.

SQL> alter database add standby logfile size 200m;

Database altered.

SQL> select group#, bytes/1024/1024 mb, status from v$standby_log;

    GROUP#         MB STATUS
---------- ---------- ----------
         4        200 UNASSIGNED
         5        200 UNASSIGNED
         6        200 UNASSIGNED
         9        200 UNASSIGNED

Double check all systems

Check NY, FS, and SF.

SQL> select count(*)numlog, bytes/1024/1024 mb from v$standby_log group by bytes;

    NUMLOG         MB
---------- ----------
         4        200

Data Guard

After a few seconds, note that the system state is normal. The protection mode is now Maximum Availability.

DGMGRL> show configuration

Configuration - ORCL_CONFIG

  Protection Mode: MaxAvailability
  Members:
  NY - Primary database
    FS - Far sync instance
      SF - Physical standby database

Fast-Start Failover:  Disabled

Configuration Status:
SUCCESS   (status updated 51 seconds ago)

Conclusion

Be aware of these lessons or practices:

  • Before duplicating the primary database, note the online redo log size. Check that all OLRs are the same size. Check that the SRLs are all the same size, and are the same size as the OLRs.
  • Recognize that a normal Data Guard in steady state should be free of warnings.
  • Before attempting to upgrade the protection level, resolve all persistent warnings.
  • Drill in to errors as follows:
    • show configuration
    • show objecttype objectname StatusReport
    • show objecttype objectname property
      where property is a monitor property, LogXptStatus in this case


Data Guard 19c in AWS with far sync

By Brian Fitzgerald

Introduction

Oracle Data Guard 19c with far sync setup is described here. Far sync can improve commit response time in a Maximum Availability Data Guard network. The Data Guard configuration is EC2 across two AWS Cloud regions. Database storage is ASM. Far sync creation is done using RMAN. The physical standby and far sync are implemented in a single configuration step. Some observations on network latency and switchover timing are shown.

License

Data Guard is a feature of the Oracle Database Enterprise Edition itself and does not require separate licensing. An Active Data Guard license is required for Far sync.

By using Amazon Elastic Cloud Computing, (EC2), you can control your license costs by configuring only the CPUs that you need.

Environment overview

A system overview is described in this table:

Description Value
Cloud AWS
Image ID ami-2051294a
Red Hat version 7.2
EC2 InstanceType m3.medium
Memory 3.75 GB
CPU 1
Swap 2 GB
Grid software owner grid
Grid Infrastructure Version 19.3.0
Database Storage ASM
Oracle software owner oracle
Oracle Database Version 19.3.0
Oracle Instance Type Restart

AWS instance type was initially m3.large (8 GB, 2 CPU), and then downsized after the grid and oracle home installations were complete. For additional information on the grid install, please refer to grid 19c install with ASM filter driver. For the network description, please refer to Data Guard network in AWS. The breakdown by region, availability zone, host, and role is:

description primary far sync standby
Region N. Virginia N. Virginia N. California
availability zone us-east-1c us-east-1d us-west-1b
ip address 172.31.86.22 172.31.28.23 172.32.10.34
hostname -s ip-172-31-86-22 ip-172-31-28-23 ip-172-32-10-34
db_unique_name NY FS SF

Network latency

We can measure the network latency from the primary to the far sync and to the standby. Start qperf server on the far sync:

[ec2-user@ip-172-31-28-23 ~]$ qperf

Start qperf server on the standby

[ec2-user@ip-172-32-10-34 ~]$ qperf

Measure bandwidth and latency between two N. Virginia availability zones:

[ec2-user@ip-172-31-86-22 ~]$ qperf 172.31.28.23 tcp_bw tcp_lat
tcp_bw:
    bw  =  92.6 MB/sec
tcp_lat:
    latency  =  254 us

Measure bandwidth and latency between regions N. Virginia and N. California:

[ec2-user@ip-172-31-86-22 ~]$ qperf 172.32.10.34 tcp_bw tcp_lat
tcp_bw:
    bw  =  18.4 MB/sec
tcp_lat:
    latency  =  33.3 ms

Network bandwidth is approximately 5x higher, and latency is more than 100x lower across in-region availability zones, compared to cross-region. This fact motivates the far-sync. actually showed that far sync can improve performance in cases where the network latency to the standby is higher than the latency to the far sync.

Database configuration

The initial primary instance configuration was:

*.archive_lag_target=900
*.audit_file_dest='/u01/app/oracle/admin/NY/adump'
*.audit_trail='db'
*.compatible='19.3.0'
*.control_files='+RECO01/NY/CONTROLFILE/current.486.1018151799','+DATA01/NY/CONTROLFILE/current.273.1018151799'
*.db_block_size=8192
*.db_create_file_dest='+DATA01'
*.db_create_online_log_dest_1='+RECO01'
*.db_create_online_log_dest_2='+DATA01'
*.db_name='ORCL'
*.db_recovery_file_dest='+RECO01'
*.db_recovery_file_dest_size=4000m
*.db_unique_name='NY'
*.dg_broker_config_file1='+DATA01/NY/dr1orcl.dat'
*.dg_broker_config_file2='+RECO01/NY/dr2orcl.dat'
*.diagnostic_dest='/u01/app/oracle'
*.dispatchers='(PROTOCOL=TCP) (SERVICE=ORCLXDB)'
*.local_listener='LISTENER_NY'
*.log_archive_format='%t_%s_%r.dbf'
*.nls_language='AMERICAN'
*.nls_territory='AMERICA'
*.open_cursors=300
*.pga_aggregate_target=360m
*.processes=300
*.remote_login_passwordfile='EXCLUSIVE'
*.sga_target=1080m
*.standby_file_management='AUTO'
*.undo_tablespace='UNDOTBS1'

If not already done, make these changes:

SQL> alter system set standby_file_management=AUTO;

System altered.

SQL> alter system set dg_broker_config_file1='+DATA01/NY/dr1orcl.dat';

System altered.

SQL> alter system set dg_broker_config_file2='+RECO01/NY/dr2orcl.dat';

System altered.

Optional settings

  • compatible. Must be set to the same value on the the primary, on the far sync, and on the standby.
  • db_create_online_log_dest_n. Points logfile members to specific disk groups. Simplifies alter database add standby logfile syntax.
  • archive_lag_target. Time-boxes each archive log. Adjust to manage control file contention.

Alter database

Make sure these alter database alterations are done:

SQL> alter database force logging;

Database altered.

Make these changes with the database mounted:

SQL> shutdown immediate
Database closed.
Database dismounted.
ORACLE instance shut down.
SQL> startup mount
ORACLE instance started.

Total System Global Area 1140849904 bytes
Fixed Size                  8895728 bytes
Variable Size             301989888 bytes
Database Buffers          822083584 bytes
Redo Buffers                7880704 bytes
Database mounted.
SQL> alter database archivelog;

Database altered.

SQL> alter database flashback on;

Database altered.

SQL> alter database open;

Database altered.

Standby logs

Identify the online redo log size. Check that all online redo logs are the same size. Check that this query returns exactly one row:

SQL> select count(*)numlogs, bytes/1024/1024 mb from v$log group by bytes;

   NUMLOGS         MB
---------- ----------
         3        200

If all online logs are not the same size, correct that condition before proceeding.

If standby redo logs exist, check that they are all the same size, and the same size as the online redo logs. Check that this query returns exactly one row:

SQL> select count(*)numlogs, bytes/1024/1024 mb from v$standby_log group by bytes;

   NUMLOGS         MB
---------- ----------
         4        200

Correct discrepant conditions before proceeding.

Create standby logs

Create standby logs, if needed. You can set:

SQL> alter system set db_create_online_log_dest_1 = '+DATA01';

System altered.

SQL> alter system set db_create_online_log_dest_2 = '+RECO01';

System altered.

And then run, for example:

SQL> alter database add standby logfile size 200m;

as many times as needed to get the desired number of standby logs. The optimal number of standby logs is usually greater than the number of online logs. If a high apply backlog is expected, then increase this number further.

Static listeners

On all hosts, primary, far sync, and standby, in the grid account, in $ORACLE_HOME/network/admin, edit listener.ora.

Primary:

SID_LIST_LISTENER =
  (SID_LIST =
    (SID_DESC =
      (ORACLE_HOME = /u01/app/oracle/product/19.3.0/dbhome_1)
      (SID_NAME = NY)
    )
  )

Far sync:

SID_LIST_LISTENER =
  (SID_LIST =
    (SID_DESC =
      (ORACLE_HOME = /u01/app/oracle/product/19.3.0/dbhome_1)
      (SID_NAME = FS)
    )
  )

Standby:

SID_LIST_LISTENER =
  (SID_LIST =
    (SID_DESC =
      (ORACLE_HOME = /u01/app/oracle/product/19.3.0/dbhome_1)
      (SID_NAME = SF)
    )
  )

Reload the listener. For example:

[grid@ip-172-31-86-22 ~]$ lsnrctl reload

LSNRCTL for Linux: Version 19.0.0.0.0 - Production on 02-SEP-2019 12:28:09

Copyright (c) 1991, 2019, Oracle. All rights reserved.

Connecting to (DESCRIPTION=(ADDRESS=(PROTOCOL=TCP)(HOST=ip-172-31-86-22.ec2.internal)(PORT=1521)))
The command completed successfully

startup far sync

On the far sync configure and startup nomount

Far sync audit directory

At the far sync

[oracle@ip-172-32-10-34 ~]$ mkdir -p /u01/app/oracle/admin/FS/adump

Far sync oratab and environment

[oracle@ip-172-31-28-23 ~]$ echo FS:/u01/app/oracle/product/19.3.0/dbhome_1:N >> /etc/oratab
[oracle@ip-172-31-28-23 ~]$ . oraenv
ORACLE_SID = [FS] ? FS
The Oracle base remains unchanged with value /u01/app/oracle

Far sync orapwd

Create orapwFS on the far sync:

[oracle@ip-172-31-28-23 ~]$ alias oh
alias oh='cd $ORACLE_HOME'
[oracle@ip-172-31-28-23 ~]$ oh
[oracle@ip-172-31-28-23 dbhome_1]$ cd dbs
[oracle@ip-172-31-28-23 dbs]$ orapwd file=orapwFS entries=10 password=zystm.22

Far sync startup

Create a temporary, minimal pfile on the far sync. Set the compatible setting to match the primary.

[oracle@ip-172-31-28-23 ops]$ cat > /tmp/initFS.ora
db_name = ORCL
compatible = '19.3.0'
^D
[oracle@ip-172-31-28-23 dbs]$ sqlplus / as sysdba

SQL*Plus: Release 19.0.0.0.0 - Production on Sat Aug 31 22:01:58 2019
Version 19.3.0.0.0

Copyright (c) 1982, 2019, Oracle.  All rights reserved.

Connected to an idle instance.

SQL> startup nomount pfile='/tmp/initFS.ora'
ORACLE instance started.

Total System Global Area  243268216 bytes
Fixed Size                  8895096 bytes
Variable Size             180355072 bytes
Database Buffers           50331648 bytes
Redo Buffers                3686400 bytes
SQL> Disconnected from Oracle Database 19c Enterprise Edition Release 19.0.0.0.0 - Production
Version 19.3.0.0.0

Startup the standby

On the standby configure and startup nomount

Standby audit directory

At the standby

[oracle@ip-172-32-10-34 ~]$ mkdir -p /u01/app/oracle/admin/SF/adump

Standby oratab and environment

[oracle@ip-172-32-10-34 ~]$ echo SF:/u01/app/oracle/product/19.3.0/dbhome_1:N >> /etc/oratab
[oracle@ip-172-32-10-34 ~]$ . oraenv
ORACLE_SID = [SF] ? SF
The Oracle base remains unchanged with value /u01/app/oracle

Standby orapwd

Create orapwSF on the standby:
[oracle@ip-172-32-10-34 ~]$ oh
[oracle@ip-172-32-10-34 dbhome_1]$ cd dbs
[oracle@ip-172-32-10-34 dbs]$ orapwd file=orapwSF entries=10 password=zystm.22

Standby startup

Create a temporary, minimal pfile on the standby. Set the compatible setting to match the primary.

[oracle@ip-172-32-10-34 ops]$ cat > /tmp/initSF.ora
db_name = ORCL
compatible = '19.3.0'
^D
[oracle@ip-172-32-10-34 dbs]$ sqlplus / as sysdba

SQL*Plus: Release 19.0.0.0.0 - Production on Sat Aug 31 22:01:58 2019
Version 19.3.0.0.0

Copyright (c) 1982, 2019, Oracle.  All rights reserved.

Connected to an idle instance.

SQL> startup nomount pfile='/tmp/initSF.ora'
ORACLE instance started.

Total System Global Area  243268216 bytes
Fixed Size                  8895096 bytes
Variable Size             180355072 bytes
Database Buffers           50331648 bytes
Redo Buffers                3686400 bytes
SQL> Disconnected from Oracle Database 19c Enterprise Edition Release 19.0.0.0.0 - Production
Version 19.3.0.0.0

tnsnames.ora

On all hosts, in the oracle account, in $ORACLE_HOME/network/admin/tnsnames.ora, add these entries:

NY =
  (DESCRIPTION =
    (ADDRESS = (PROTOCOL = TCP)(HOST = 172.31.86.22)(PORT = 1521))
    (CONNECT_DATA =
      (SID = NY)
    )
  )

FS =
  (DESCRIPTION =
    (ADDRESS = (PROTOCOL = TCP)(HOST = 172.31.28.23)(PORT = 1521))
    (CONNECT_DATA =
      (SID = FS)
    )
  )

SF =
  (DESCRIPTION =
    (ADDRESS = (PROTOCOL = TCP)(HOST = 172.32.10.34)(PORT = 1521))
    (CONNECT_DATA =
      (SID = SF)
    )
  )

Connectivity checklist

Check that you have configured all of these:

  • VPC enable DNS hostnames
  • DNS resolution across the peering connection
  • Route tables across the peering connection
  • Security groups
  • Static listener
  • orapwd
  • tnsnames.ora
  • ORACLE_HOME environment variable

Test connectivity

From the primary, test connectivity to all three instances:

sqlplus sys/zystm.22@OH as sysdba
sqlplus sys/zystm.22@VA_FS as sysdba
sqlplus sys/zystm.22@OH as sysdba

From the far sync and the standby, repeat these checks.

Duplicate primary to far sync

Now we are going to kick off an RMAN script. RMAN will transfer the spfile, the password file, and the control file.

[oracle@ip-172-31-86-22 ops]$ cat dup.db.farsync.rcv
DUPLICATE TARGET DATABASE
  FOR FARSYNC
  FROM ACTIVE DATABASE
  SPFILE
    SET db_unique_name='FS'
    SET dg_broker_config_file1='+DATA01/FS/dr1orcl.dat'
    SET dg_broker_config_file2='+RECO01/FS/dr2orcl.dat'
    SET audit_file_dest='/u01/app/oracle/admin/FS/adump'
  NOFILENAMECHECK;
[oracle@ip-172-31-86-22 ops]$ rman target sys/zystm.22@NY auxiliary sys/zystm.22@FS

Recovery Manager: Release 19.0.0.0.0 - Production on Thu Sep 5 04:53:02 2019
Version 19.3.0.0.0

Copyright (c) 1982, 2019, Oracle and/or its affiliates.  All rights reserved.

connected to target database: ORCL (DBID=1545932534)
connected to auxiliary database: ORCL (not mounted)

RMAN> @ dup.db.farsync.rcv

RMAN> DUPLICATE TARGET DATABASE
2>   FOR FARSYNC
3>   FROM ACTIVE DATABASE
4>   SPFILE
5>     SET db_unique_name='FS'
6>     SET dg_broker_config_file1='+DATA01/FS/dr1orcl.dat'
7>     SET dg_broker_config_file2='+RECO01/FS/dr2orcl.dat'
8>     SET audit_file_dest='/u01/app/oracle/admin/FS/adump'
9>   NOFILENAMECHECK;
Starting Duplicate Db at 05-SEP-19
using target database control file instead of recovery catalog
allocated channel: ORA_AUX_DISK_1
channel ORA_AUX_DISK_1: SID=39 device type=DISK

contents of Memory Script:
{
   backup as copy reuse
   passwordfile auxiliary format  '/u01/app/oracle/product/19.3.0/dbhome_1/dbs/orapwORCL'   ;
   restore clone from service  'NY' spfile to
 '/u01/app/oracle/product/19.3.0/dbhome_1/dbs/spfileORCL.ora';
   sql clone "alter system set spfile= ''/u01/app/oracle/product/19.3.0/dbhome_1/dbs/spfileORCL.ora''";
}
executing Memory Script

Starting backup at 05-SEP-19
allocated channel: ORA_DISK_1
channel ORA_DISK_1: SID=88 device type=DISK
Finished backup at 05-SEP-19

Starting restore at 05-SEP-19
using channel ORA_AUX_DISK_1

channel ORA_AUX_DISK_1: starting datafile backup set restore
channel ORA_AUX_DISK_1: using network backup set from service NY
channel ORA_AUX_DISK_1: restoring SPFILE
output file name=/u01/app/oracle/product/19.3.0/dbhome_1/dbs/spfileORCL.ora
channel ORA_AUX_DISK_1: restore complete, elapsed time: 00:00:01
Finished restore at 05-SEP-19

sql statement: alter system set spfile= ''/u01/app/oracle/product/19.3.0/dbhome_1/dbs/spfileORCL.ora''

contents of Memory Script:
{
   sql clone "alter system set  db_unique_name =
 ''FS'' comment=
 '''' scope=spfile";
   sql clone "alter system set  dg_broker_config_file1 =
 ''+DATA01/FS/dr1orcl.dat'' comment=
 '''' scope=spfile";
   sql clone "alter system set  dg_broker_config_file2 =
 ''+RECO01/FS/dr2orcl.dat'' comment=
 '''' scope=spfile";
   sql clone "alter system set  audit_file_dest =
 ''/u01/app/oracle/admin/FS/adump'' comment=
 '''' scope=spfile";
   shutdown clone immediate;
   startup clone nomount;
}
executing Memory Script

sql statement: alter system set  db_unique_name =  ''FS'' comment= '''' scope=spfile

sql statement: alter system set  dg_broker_config_file1 =  ''+DATA01/FS/dr1orcl.dat'' comment= '''' scope=spfile

sql statement: alter system set  dg_broker_config_file2 =  ''+RECO01/FS/dr2orcl.dat'' comment= '''' scope=spfile

sql statement: alter system set  audit_file_dest =  ''/u01/app/oracle/admin/FS/adump'' comment= '''' scope=spfile

Oracle instance shut down

connected to auxiliary database (not started)
Oracle instance started

Total System Global Area    1140849904 bytes

Fixed Size                     8895728 bytes
Variable Size                301989888 bytes
Database Buffers             822083584 bytes
Redo Buffers                   7880704 bytes
duplicating Online logs to Oracle Managed File (OMF) location
duplicating Datafiles to Oracle Managed File (OMF) location

contents of Memory Script:
{
   sql clone "alter system set  control_files =
  ''+RECO01/FS/CONTROLFILE/current.257.1018155321'', ''+DATA01/FS/CONTROLFILE/current.258.1018155321'' comment=
 ''Set by RMAN'' scope=spfile";
   restore clone from service  'NY' farsync controlfile;
}
executing Memory Script

sql statement: alter system set  control_files =   ''+RECO01/FS/CONTROLFILE/current.257.1018155321'', ''+DATA01/FS/CONTROLFILE/current.258.1018155321'' comment= ''Set by RMAN'' scope=spfile

Starting restore at 05-SEP-19
allocated channel: ORA_AUX_DISK_1
channel ORA_AUX_DISK_1: SID=46 device type=DISK

channel ORA_AUX_DISK_1: starting datafile backup set restore
channel ORA_AUX_DISK_1: using network backup set from service NY
channel ORA_AUX_DISK_1: restoring control file
channel ORA_AUX_DISK_1: restore complete, elapsed time: 00:00:01
output file name=+RECO01/FS/CONTROLFILE/current.383.1018155325
output file name=+DATA01/FS/CONTROLFILE/current.265.1018155325
Finished restore at 05-SEP-19

contents of Memory Script:
{
   sql clone 'alter database mount';
}
executing Memory Script

sql statement: alter database mount

contents of Memory Script:
{
   sql 'alter system archive log current';
}
executing Memory Script

sql statement: alter system archive log current
Finished Duplicate Db at 05-SEP-19

RMAN> **end-of-file**

Note that there are no online logs, and that the standby logs are the same count and size as the primary.

SQL> select count(*)numlogs, bytes/1024/1024 mb from v$log group by bytes;

no rows selected

SQL> select count(*)numlogs, bytes/1024/1024 mb from v$standby_log group by bytes;

   NUMLOGS         MB
---------- ----------
         4        200

Notice these points about the operation:

  • All file transfers were done with RMAN. No ssh connection is needed.
  • There is no ALTER DATABASE CREATE FAR SYNC INSTANCE CONTROLFILE step. RMAN handled the control file by backing it up at the primary and tranferring it to the far sync.
  • Although the primary spfile is in ASM, the far sync spfile ends up on the file system in directory $ORACLE_HOME/dbs.
  • The orapwORCL that you created at the far sync got overwritten by a backup of the primary orapwORCL.

Duplicate primary to standby

Allocate an appropriate number of channels to reduce the time needed to duplicate the database.

[oracle@ip-172-31-86-22 ops]$ cat dup.db.standby.rcv
run {

allocate channel ch01 device type disk;
allocate channel ch02 device type disk;
allocate auxiliary channel aux01 device type disk;
allocate auxiliary channel aux02 device type disk;

DUPLICATE TARGET DATABASE
  FOR STANDBY
  FROM ACTIVE DATABASE
  DORECOVER
  SPFILE
    SET db_unique_name='SF'
    SET dg_broker_config_file1='+DATA01/SF/dr1orcl.dat'
    SET dg_broker_config_file2='+RECO01/SF/dr2orcl.dat'
    SET audit_file_dest='/u01/app/oracle/admin/SF/adump'
  NOFILENAMECHECK;

}
[oracle@ip-172-31-86-22 ops]$ vi dup.db.standby.rcv
[oracle@ip-172-31-86-22 ops]$ rman target sys/zystm.22@NY auxiliary sys/zystm.22@SF

Recovery Manager: Release 19.0.0.0.0 - Production on Thu Sep 5 05:04:52 2019
Version 19.3.0.0.0

Copyright (c) 1982, 2019, Oracle and/or its affiliates.  All rights reserved.

connected to target database: ORCL (DBID=1545932534)
connected to auxiliary database: ORCL (not mounted)

RMAN> @ dup.db.standby.rcv

RMAN> run {
2>
3> allocate channel ch01 device type disk;
4> allocate channel ch02 device type disk;
5> allocate auxiliary channel aux01 device type disk;
6> allocate auxiliary channel aux02 device type disk;
7>
8> DUPLICATE TARGET DATABASE
9>   FOR STANDBY
10>   FROM ACTIVE DATABASE
11>   DORECOVER
12>   SPFILE
13>     SET db_unique_name='SF'
14>     SET dg_broker_config_file1='+DATA01/SF/dr1orcl.dat'
15>     SET dg_broker_config_file2='+RECO01/SF/dr2orcl.dat'
16>     SET audit_file_dest='/u01/app/oracle/admin/SF/adump'
17>   NOFILENAMECHECK;
18>
19> }
using target database control file instead of recovery catalog
allocated channel: ch01
channel ch01: SID=84 device type=DISK

allocated channel: ch02
channel ch02: SID=85 device type=DISK

allocated channel: aux01
channel aux01: SID=40 device type=DISK

allocated channel: aux02
channel aux02: SID=41 device type=DISK

Starting Duplicate Db at 05-SEP-19
current log archived

contents of Memory Script:
{
   backup as copy reuse
   passwordfile auxiliary format  '/u01/app/oracle/product/19.3.0/dbhome_1/dbs/orapwORCL'   ;
   restore clone from service  'NY' spfile to
 '/u01/app/oracle/product/19.3.0/dbhome_1/dbs/spfileORCL.ora';
   sql clone "alter system set spfile= ''/u01/app/oracle/product/19.3.0/dbhome_1/dbs/spfileORCL.ora''";
}
executing Memory Script

Starting backup at 05-SEP-19
Finished backup at 05-SEP-19

Starting restore at 05-SEP-19

channel aux01: starting datafile backup set restore
channel aux01: using network backup set from service NY
channel aux01: restoring SPFILE
output file name=/u01/app/oracle/product/19.3.0/dbhome_1/dbs/spfileORCL.ora
channel aux01: restore complete, elapsed time: 00:00:02
Finished restore at 05-SEP-19

sql statement: alter system set spfile= ''/u01/app/oracle/product/19.3.0/dbhome_1/dbs/spfileORCL.ora''

contents of Memory Script:
{
   sql clone "alter system set  db_unique_name =
 ''SF'' comment=
 '''' scope=spfile";
   sql clone "alter system set  dg_broker_config_file1 =
 ''+DATA01/SF/dr1orcl.dat'' comment=
 '''' scope=spfile";
   sql clone "alter system set  dg_broker_config_file2 =
 ''+RECO01/SF/dr2orcl.dat'' comment=
 '''' scope=spfile";
   sql clone "alter system set  audit_file_dest =
 ''/u01/app/oracle/admin/SF/adump'' comment=
 '''' scope=spfile";
   shutdown clone immediate;
   startup clone nomount;
}
executing Memory Script

sql statement: alter system set  db_unique_name =  ''SF'' comment= '''' scope=spfile

sql statement: alter system set  dg_broker_config_file1 =  ''+DATA01/SF/dr1orcl.dat'' comment= '''' scope=spfile

sql statement: alter system set  dg_broker_config_file2 =  ''+RECO01/SF/dr2orcl.dat'' comment= '''' scope=spfile

sql statement: alter system set  audit_file_dest =  ''/u01/app/oracle/admin/SF/adump'' comment= '''' scope=spfile

Oracle instance shut down

connected to auxiliary database (not started)
Oracle instance started

Total System Global Area    1140849904 bytes

Fixed Size                     8895728 bytes
Variable Size                301989888 bytes
Database Buffers             822083584 bytes
Redo Buffers                   7880704 bytes
allocated channel: aux01
channel aux01: SID=44 device type=DISK
allocated channel: aux02
channel aux02: SID=45 device type=DISK
duplicating Online logs to Oracle Managed File (OMF) location
duplicating Datafiles to Oracle Managed File (OMF) location

contents of Memory Script:
{
   sql clone "alter system set  control_files =
  ''+RECO01/SF/CONTROLFILE/current.257.1018156101'', ''+DATA01/SF/CONTROLFILE/current.258.1018156101'' comment=
 ''Set by RMAN'' scope=spfile";
   restore clone from service  'NY' standby controlfile;
}
executing Memory Script

sql statement: alter system set  control_files =   ''+RECO01/SF/CONTROLFILE/current.257.1018156101'', ''+DATA01/SF/CONTROLFILE/current.258.1018156101'' comment= ''Set by RMAN'' scope=spfile

Starting restore at 05-SEP-19

channel aux01: starting datafile backup set restore
channel aux01: using network backup set from service NY
channel aux01: restoring control file
channel aux01: restore complete, elapsed time: 00:00:04
output file name=+RECO01/SF/CONTROLFILE/current.262.1018156111
output file name=+DATA01/SF/CONTROLFILE/current.267.1018156111
Finished restore at 05-SEP-19

contents of Memory Script:
{
   sql clone 'alter database mount standby database';
}
executing Memory Script

sql statement: alter database mount standby database

contents of Memory Script:
{
   set newname for clone tempfile  1 to new;
   switch clone tempfile all;
   set newname for clone datafile  1 to new;
   set newname for clone datafile  3 to new;
   set newname for clone datafile  4 to new;
   set newname for clone datafile  7 to new;
   restore
   from  nonsparse   from service
 'NY'   clone database
   ;
   sql 'alter system archive log current';
}
executing Memory Script

executing command: SET NEWNAME

renamed tempfile 1 to +DATA01 in control file

executing command: SET NEWNAME

executing command: SET NEWNAME

executing command: SET NEWNAME

executing command: SET NEWNAME

Starting restore at 05-SEP-19

channel aux01: starting datafile backup set restore
channel aux01: using network backup set from service NY
channel aux01: specifying datafile(s) to restore from backup set
channel aux01: restoring datafile 00001 to +DATA01
channel aux02: starting datafile backup set restore
channel aux02: using network backup set from service NY
channel aux02: specifying datafile(s) to restore from backup set
channel aux02: restoring datafile 00003 to +DATA01
channel aux02: restore complete, elapsed time: 00:00:38
channel aux02: starting datafile backup set restore
channel aux02: using network backup set from service NY
channel aux02: specifying datafile(s) to restore from backup set
channel aux02: restoring datafile 00004 to +DATA01
channel aux01: restore complete, elapsed time: 00:00:44
channel aux01: starting datafile backup set restore
channel aux01: using network backup set from service NY
channel aux01: specifying datafile(s) to restore from backup set
channel aux01: restoring datafile 00007 to +DATA01
channel aux01: restore complete, elapsed time: 00:00:05
channel aux02: restore complete, elapsed time: 00:00:12
Finished restore at 05-SEP-19

sql statement: alter system archive log current
current log archived

contents of Memory Script:
{
   restore clone force from service  'NY'
           archivelog from scn  2246774;
   switch clone datafile all;
}
executing Memory Script

Starting restore at 05-SEP-19

channel aux01: starting archived log restore to default destination
channel aux01: using network backup set from service NY
channel aux01: restoring archived log
archived log thread=1 sequence=9
channel aux02: starting archived log restore to default destination
channel aux02: using network backup set from service NY
channel aux02: restoring archived log
archived log thread=1 sequence=10
channel aux01: restore complete, elapsed time: 00:00:02
channel aux02: restore complete, elapsed time: 00:00:02
Finished restore at 05-SEP-19

datafile 1 switched to datafile copy
input datafile copy RECID=5 STAMP=1018156184 file name=+DATA01/SF/DATAFILE/system.266.1018156127
datafile 3 switched to datafile copy
input datafile copy RECID=6 STAMP=1018156184 file name=+DATA01/SF/DATAFILE/sysaux.265.1018156129
datafile 4 switched to datafile copy
input datafile copy RECID=7 STAMP=1018156184 file name=+DATA01/SF/DATAFILE/undotbs1.264.1018156167
datafile 7 switched to datafile copy
input datafile copy RECID=8 STAMP=1018156184 file name=+DATA01/SF/DATAFILE/users.269.1018156173

contents of Memory Script:
{
   set until scn  2247713;
   recover
   standby
   clone database
    delete archivelog
   ;
}
executing Memory Script

executing command: SET until clause

Starting recover at 05-SEP-19

starting media recovery

archived log for thread 1 with sequence 9 is already on disk as file +RECO01/SF/ARCHIVELOG/2019_09_05/thread_1_seq_9.261.1018156181
archived log for thread 1 with sequence 10 is already on disk as file +RECO01/SF/ARCHIVELOG/2019_09_05/thread_1_seq_10.259.1018156183
archived log file name=+RECO01/SF/ARCHIVELOG/2019_09_05/thread_1_seq_9.261.1018156181 thread=1 sequence=9
archived log file name=+RECO01/SF/ARCHIVELOG/2019_09_05/thread_1_seq_10.259.1018156183 thread=1 sequence=10
media recovery complete, elapsed time: 00:00:01
Finished recover at 05-SEP-19

contents of Memory Script:
{
   delete clone force archivelog all;
}
executing Memory Script

deleted archived log
archived log file name=+RECO01/SF/ARCHIVELOG/2019_09_05/thread_1_seq_9.261.1018156181 RECID=1 STAMP=1018156181
Deleted 1 objects

deleted archived log
archived log file name=+RECO01/SF/ARCHIVELOG/2019_09_05/thread_1_seq_10.259.1018156183 RECID=2 STAMP=1018156182
Deleted 1 objects

Finished Duplicate Db at 05-SEP-19
released channel: ch01
released channel: ch02
released channel: aux01
released channel: aux02

RMAN> **end-of-file**

RMAN>

Recovery Manager complete.

Notice that the online logs and the standby logs are the same as the primary:

SQL> select count(*)numlogs, bytes/1024/1024 mb from v$log group by bytes;

   NUMLOGS         MB
---------- ----------
         3        200

SQL> select count(*)numlogs, bytes/1024/1024 mb from v$standby_log group by bytes;

   NUMLOGS         MB
---------- ----------
         4        200

Configure restart

All new systems should be mounted at this stage. Register your restart instances. (At the primary, this step might already be done.)

[oracle@ip-172-31-86-22 ~]$ srvctl add database -database NY -role PRIMARY -stopoption IMMEDIATE -instance ORCL -oraclehome /u01/app/oracle/product/19.3.0/dbhome_1 -spfile +DATA01/ORCL/PARAMETERFILE/spfile.266.1017440879 -diskgroup DATA01,RECO01

At the far sync:

[oracle@ip-172-31-28-23 ~]$ srvctl add database -database FS -role physical_standby -startoption MOUNT -stopoption ABORT -instance FS -oraclehome /u01/app/oracle/product/19.3.0/dbhome_1 -spfile /u01/app/oracle/product/19.3.0/dbhome_1/dbs/spfileFS.ora -diskgroup DATA01,RECO01

To activate the change, I found it necessary to issue srvctl start. That does not seem right. “srvctl enable database” should do it. In restart, “srvctl enable instance” is not available. Unless you activate the instance, it will not start automatically upon host reboot.

[oracle@ip-172-31-28-23 ~]$ srvctl start database -database FS

At the standby:

[oracle@ip-172-32-10-34 ~]$ srvctl add database -database SF -role physical_standby -startoption MOUNT -stopoption ABORT -instance SF -oraclehome /u01/app/oracle/product/19.3.0/dbhome_1 -spfile /u01/app/oracle/product/19.3.0/dbhome_1/dbs/spfileSF.ora -diskgroup DATA01,RECO01
[oracle@ip-172-32-10-34 ~]$ srvctl start database -database SF

Reboot all hosts and check that the database instances start automatically, in the proper startup mode.

Validate static listeners

Validating the static listeners is critical. For each database or far sync (NY, FS, SF):

  • Connect over the network with sqlplus
  • Shutdown (shutdown abort for standbys and far syncs)
  • Startup (startup mount for standbys and far syncs)

Example:

[oracle@ip-172-31-28-23 ops]$ sqlplus sys/zystm.22@FS as sysdba

SQL*Plus: Release 19.0.0.0.0 - Production on Fri Sep 13 11:36:37 2019
Version 19.3.0.0.0

Copyright (c) 1982, 2019, Oracle.  All rights reserved.


Connected to:
Oracle Database 19c Enterprise Edition Release 19.0.0.0.0 - Production
Version 19.3.0.0.0

SQL> shutdown abort
ORACLE instance shut down.
SQL> startup mount
ORACLE instance started.

Total System Global Area 1140849904 bytes
Fixed Size                  8895728 bytes
Variable Size             301989888 bytes
Database Buffers          822083584 bytes
Redo Buffers                7880704 bytes
Database mounted.

This is an example of a failed static listener check.

[oracle@ip-172-31-28-23 ops]$ sqlplus sys/zystm.22@FS as sysdba

SQL*Plus: Release 19.0.0.0.0 - Production on Fri Sep 13 11:36:37 2019
Version 19.3.0.0.0

Copyright (c) 1982, 2019, Oracle.  All rights reserved.


Connected to:
Oracle Database 19c Enterprise Edition Release 19.0.0.0.0 - Production
Version 19.3.0.0.0

SQL> shutdown abort
ORACLE instance shut down.
SQL> startup mount
ORACLE instance started.

Total System Global Area 1140849904 bytes
Fixed Size                  8895728 bytes
Variable Size             301989888 bytes
Database Buffers          822083584 bytes
Redo Buffers                7880704 bytes
Database mounted.
SQL> shutdown abort
ORACLE instance shut down.
ERROR:
ORA-12505: TNS:listener does not currently know of SID given in connect
descriptor


SQL> startup mount
SP2-0640: Not connected

Resolve all failures before proceeding.

Broker start

At this stage, primary database is open and the far sync and standby intances are mounted. At the primary, far sync, and standby, start the Data Guard broker:

SQL> alter system set dg_broker_start = true;

System altered.

Create the broker configuration

Connect to the Data Guard broker:

[oracle@ip-172-31-86-22 broker]$ dgmgrl sys/zystm.22@NY
DGMGRL for Linux: Release 19.0.0.0.0 - Production on Mon Sep 2 13:59:25 2019
Version 19.3.0.0.0

Copyright (c) 1982, 2019, Oracle and/or its affiliates.  All rights reserved.

Welcome to DGMGRL, type "help" for information.
Connected to "NY"
Connected as SYSDBA.

Create the Data Guard broker configuration. One way to do it is to create and test the standby first, and add the far sync later. However, in this example, we add the far sync and the standby in one fell swoop.

While creating new objects, if you want to preserve name case, you should quote your identifiers.

DGMGRL> create configuration 'ORCL_CONFIG' as primary database is 'NY' connect identifier is 'NY';
Configuration "ORCL_CONFIG" created with primary database "NY"
DGMGRL> add far_sync 'FS' as connect identifier is 'FS';
far sync instance "FS" added
DGMGRL> add database 'SF' as connect identifier is 'SF' maintained as physical;
Database "SF" added

Add the redo routes:

DGMGRL> edit database NY set property RedoRoutes = '(LOCAL : FS SYNC)';
Property "redoroutes" updated
DGMGRL> edit database SF set property RedoRoutes = '(LOCAL : FS SYNC)';
Property "redoroutes" updated
DGMGRL> edit far_sync FS set property RedoRoutes = '(NY : SF ASYNC)(SF : NY ASYNC)';
Property "redoroutes" updated

Enable the configuration

DGMGRL> enable configuration
Enabled.

A point of interest is the fal_server configuration symmetry.

parameter primary far sync standby
fal_server ‘FS’,’SF’* ‘NY’,’SF’ ‘FS’,’NY’

* after switchover

The Data Guard broker sets fal_server at the far sync and standby when you enable the configuration. If you perform a switchover, the broker sets fal_server at the new standby and clears fal_server at the old standby.

Switchover test

Test switchover to SF. The output becomes:

DGMGRL> switchover to SF
Performing switchover NOW, please wait...
Operation requires a connection to database "SF"
Connecting ...
Connected to "SF"
Connected as SYSDBA.
New primary database "SF" is opening...
Oracle Clusterware is restarting database "NY" ...
Connected to an idle instance.
Connected to "NY"
Connected to "NY"
Switchover succeeded, new primary is "sf"

Test switchover to NY. The output is now:

DGMGRL> switchover to NY
Performing switchover NOW, please wait...
New primary database "NY" is opening...
Oracle Clusterware is restarting database "SF" ...
Connected to an idle instance.
Connected to "SF"
Connected to "SF"
Switchover succeeded, new primary is "ny"

Setting the protection mode

Maximum Performance

In Maximum Performance protection mode:

Transactions commit as soon as all redo data generated by those transactions has been written to the online log

Maximum Availability

In Maximum Availability mode:

Under normal operations, transactions do not commit until all redo data needed to recover those transactions has been written to the online redo log AND based on user configuration, one of the following is true:

    • redo has been received at the standby, I/O to the standby redo log has been initiated, and acknowledgement sent back to primary
    • redo has been received and written to standby redo log at the standby and acknowledgement sent back to primary

If the primary does not receive acknowledgement from at least one synchronized standby, then it operates as if it were in maximum performance mode to preserve primary database availability until it is again able to write its redo stream to a synchronized standby database.

With far sync, replace “standby” in the preceding description with “far sync”. Transactions do not commit until redo has been written to the far sync standby log. Because the far sync is in the same region as the primary, commit performance of a Maximum Availability system is expected to be better with a far sync.

Set protection mode to Maximum Availability.

DGMGRL> edit configuration set protection mode as MaxAvailability;
Succeeded.

Wait a few minutes and check:

DGMGRL> show configuration

Configuration - ORCL_CONFIG

  Protection Mode: MaxAvailability
  Members:
  NY - Primary database
    FS - Far sync instance
      SF - Physical standby database

Fast-Start Failover:  Disabled

Configuration Status:
SUCCESS   (status updated 51 seconds ago)

Test switchover and switch back:

DGMGRL> switchover to SF
Performing switchover NOW, please wait...
Operation requires a connection to database "SF"
Connecting ...
Connected to "SF"
Connected as SYSDBA.
New primary database "SF" is opening...
Oracle Clusterware is restarting database "NY" ...
Connected to an idle instance.
Connected to "NY"
Connected to "NY"
Switchover succeeded, new primary is "sf"
DGMGRL> switchover to NY
Performing switchover NOW, please wait...
Operation requires a connection to database "NY"
Connecting ...
Connected to "NY"
Connected as SYSDBA.
New primary database "NY" is opening...
Oracle Clusterware is restarting database "SF" ...
Connected to an idle instance.
Connected to "SF"
Connected to "SF"
Switchover succeeded, new primary is "ny"

Notice at the far sync that one or more standby logs are assigned

SQL> select group#, bytes/1024/1024 mb, thread#, sequence#, status from v$standby_log;

    GROUP#         MB    THREAD#  SEQUENCE# STATUS
---------- ---------- ---------- ---------- ----------
         1        200          1        572 ACTIVE
         2        200          1          0 UNASSIGNED
         3        200          1          0 UNASSIGNED
         4        200          0          0 UNASSIGNED

and at the physical standby one or more standby logs are assigned.

SQL> select group#, bytes/1024/1024 mb, thread#, sequence#, status from v$standby_log;

    GROUP#         MB    THREAD#  SEQUENCE# STATUS
---------- ---------- ---------- ---------- ----------
         4        200          1          0 UNASSIGNED
         5        200          1        572 ACTIVE
         6        200          0          0 UNASSIGNED
         7        200          0          0 UNASSIGNED

Disabling far sync

You can disable far sync

DGMGRL> edit database NY set property RedoRoutes = '(LOCAL : SF SYNC)';
Property "redoroutes" updated
DGMGRL> edit database SF set property RedoRoutes = '(LOCAL : NY SYNC)';
Property "redoroutes" updated
DGMGRL> edit far_sync FS set property RedoRoutes = '';
Property "redoroutes" updated
DGMGRL> disable far_sync FS
Disabled.

The configuration display looks like this:

DGMGRL> show configuration

Configuration - ORCL_CONFIG

  Protection Mode: MaxAvailability
  Members:
  NY - Primary database
    SF - Physical standby database

  Members Not Receiving Redo:
  FS - Far sync instance (disabled)
    ORA-16749: The member was disabled manually.

Fast-Start Failover:  Disabled

Configuration Status:
SUCCESS   (status updated 24 seconds ago)

Re-enabling far sync

You can re-enable far sync. You must touch the objects in the reverse order that you did when you disabled far sync: far sync, far sync redo routes, database redo routes.

DGMGRL> enable far_sync FS
Enabled.
DGMGRL> edit far_sync FS set property RedoRoutes = '(NY : SF ASYNC)(SF : NY ASYNC)';
Property "redoroutes" updated
DGMGRL> edit database SF set property RedoRoutes = '(LOCAL : FS SYNC)';
Property "redoroutes" updated
DGMGRL> edit database NY set property RedoRoutes = '(LOCAL : FS SYNC)';
Property "redoroutes" updated

Check:

DGMGRL> show configuration

Configuration - ORCL_CONFIG

  Protection Mode: MaxAvailability
  Members:
  NY - Primary database
    FS - Far sync instance
      SF - Physical standby database

Fast-Start Failover:  Disabled

Configuration Status:
SUCCESS   (status updated 39 seconds ago)

Removing the far sync

You can remove a disabled far sync from the configuration.

DGMGRL> remove far_sync FS
Removed far sync instance "fs" from the configuration

Switchover performance

We want to know how long after starting the switchover until the new primary is available. In other words how much time elapsed from when the switchover command is issued until the new primary is open. The times appear in the alert log. For example:

2019-09-05T14:44:04.271609-04:00
SWITCHOVER VERIFY BEGIN
...
2019-09-05T14:44:59.392512-04:00
TMI: adbdrv open database END 2019-09-05 14:44:59.392313
Starting background process CJQ0
Completed: ALTER DATABASE OPEN

We can compare database opening time with far sync

  Protection Mode: MaxAvailability
  Members:
  NY - Primary database
    FS - Far sync instance
      SF - Physical standby database

to time without far sync (direct route)

  Protection Mode: MaxAvailability
  Members:
  NY - Primary database
    SF - Physical standby database

With far sync, the switchover timing data are:

sw to date start sw new primary open elapsed time to open (s) redo route prot level
SF 9/5/2019 05:54:16.9 05:55:11.4 54.6 far sync Max Perf
NY 9/5/2019 06:02:11.7 06:04:12.2 120.5 far sync Max Perf
SF 9/5/2019 06:09:34.2 06:10:40.9 66.8 far sync Max Perf
NY 9/5/2019 06:13:32.7 06:15:21.9 109.1 far sync Max Perf
SF 9/5/2019 13:38:38.6 13:40:18.1 99.5 far sync Max Avail
NY 9/5/2019 14:07:56.7 14:10:23.7 147.0 far sync Max Avail
SF 9/5/2019 14:15:32.9 14:17:58.9 145.9 far sync Max Avail
NY 9/5/2019 14:20:04.6 14:21:38.9 94.3 far sync Max Avail
Average 104.7
Stdev 33.5

compared to without far sync:

sw to date start sw new primary open elapsed time to open (s) redo route prot level
SF 9/5/2019 06:19:48.0 06:20:47.4 59.4 direct Max Perf
NY 9/5/2019 06:23:10.5 06:24:06.8 56.3 direct Max Perf
SF 9/5/2019 06:27:20.5 06:28:19.5 59.0 direct Max Perf
NY 9/5/2019 06:29:57.2 06:30:54.0 56.8 direct Max Perf
SF 9/5/2019 14:34:49.6 14:35:50.1 60.5 direct Max Avail
NY 9/5/2019 14:38:04.4 14:38:59.3 54.9 direct Max Avail
SF 9/5/2019 14:40:59.6 14:41:58.1 58.5 direct Max Avail
NY 9/5/2019 14:44:04.3 14:44:59.4 55.1 direct Max Avail
Average 57.6
Stdev 2.1

Without far sync, switchover time is lower (Average) and more consistent (Stdev). Far sync, therefore, imposes a switchover time penalty.

Conclusion

A far sync implementation is presented. There are several points of interest.

  • The platform is Red Hat Linux 7.2 on Amazon AWS EC2.
  • The network setup is described in a separate article.
  • You can measure network latency and throughput with qperf.
  • The grid and oracle home users are separate accounts.
  • Database storage is in ASM, not operating system files.
  • The number of standby log files depends on the expected workload.
  • Parameter compatible must be set the same at the primary, far sync, and standby.
  • Check standby log size before duplicating the database.
  • File transfer is by RMAN only.
  • SSH trust is not required to setup Data Guard.
  • Multiple RMAN channels should be used to duplicate the database.
  • Configure Restart for all instances.
  • Validate the static listeners
  • Data Guard configuration and operations are done from the broker, not sqlplus.
  • The the standby and the far sync are set up at the same time, not separately.
  • Reboot hosts and confirm automatic startup, startup mode, and Data Guard role.
  • Test switchover after configuring restart.
  • Data Guard broker manages fal_server at all nodes during role transitions.
  • You can change the protection mode to Maximum Availability.
  • Far sync can reduce or prevent data loss.
  • With far sync, switchover takes longer and the elapsed time is less consistent.

We have presented an Oracle Data Guard 19c setup with far sync. Some techniques here are variants on contributions found elsewhere. Some findings on performance are presented.

Tail call optimization in Scala

By Brian Fitzgerald

Summary

We analyze a Scala function with a recursive tail call, and show that the compiler rewrites it as a nonrecursive loop. We use the @tailrec annotation to verify the optimization.Printing the stack at run time confirms the optimization. Bytecode analysis shows optimization implementation details, and how the java virtual machine manages the stack for the recursive and iterative cases. A bytecode decompiler reverse engineers the bytecode into possible source codes. While Scala supports tail call elimination, Java does not.

Recursion

Recursion is when a function calls itself, usually for the purpose of divide and conquer, meaning dividing a large problem into smaller pieces, and solving the smaller problems. Quicksort is a great example of divide and conquer, and is a problem that can be solved using a recursive algorithm.

Imperative languages make judicious use of recursion. We might use imperative languages without realizing that is what they are called. Imperative programming means executing a series of steps in order. For example:

restore database;
recover database;
alter database open resetlogs;

On the other hand, pure functional languages express actions as functions. Claimed advantages are that side-effect-free functions and immutable data lead to improved readability, maintainability, and concurrency.

In a pure functional language, iteration is implemented as recursion. Usually, recursion works by placing the caller’s return address and the calling arguments on the stack, and then jumping to the same function. In the call, the function accesses the values on the stack as local variables. In the return, the function result is loaded into the caller’s operand stack, and the current frame is discarded. Execution resumes in the caller. Ordinarily, stack resources would limit such an approach.

Enter the tail call. If the recursive call comes just before the return, then the recursion can be optimized as iteration. No stack frame is allocated. The return is implemented as a goto.

The objective of this blog post is to see how tail call optimization works.

Recursion Example

This example calculates the nth Fibonacci number, conventionally indexed from 0 as 0, 1, 1, 2, 3 etc. or from 1 as 1, 1, 2, 3, ,etc. I have divided the program into two files for later analysis.

object FibTailRec contains fib, the inner, recursive function. The arguments are i, p, and f

  • i: the counter, counting down from n
  • p: the previous Fibonacci number
  • f: the Fibonacci number
package fibo

object FibTailRec {

  def fib(i: Int, p: Int, f: Int): Int = i match {
    case 0 => p
    case _ => fib(i - 1, f, p + f)
  }
}

Here is the driver. It has two functions. main calls function fibTailRec with a value (“6”), and prints the result. fibTailResult calls fib with n and seed values for p and f.

import fibo.FibTailRec.fib

object RunFibTailRec {

  def main(args: Array[String]): Unit = {
    println(fibTailRec(6))
  }

  def fibTailRec(n: Int): Int =
    fib(n, 0, 1)

}

The output:

8

The @tailrec annotation

To make sure that the compiler optmized the tail call, we make two changes. This import

import scala.annotation.tailrec

and the @tailrec annotation.

package fibo
import scala.annotation.tailrec

object FibTailRec {

  @tailrec def fib(i: Int, p: Int, f: Int): Int = i match {
    case 0 => p
    case _ => fib(i - 1, f, p + f)
  }
}

The code compiles, so we know that the compiler optimized the tail call.

Displaying the stack

We can also display the stack at the innermost recursion depth by replacing

    case 0 => p

with

   case 0 => {
      new Exception().printStackTrace()
      p
    }

The modified function looks like this:

package fibo
import scala.annotation.tailrec

object FibTailRec {

  @tailrec def fib(i: Int, p: Int, f: Int): Int = i match {
    case 0 => {
      new Exception().printStackTrace()
      p
    }
    case _ => fib(i - 1, f, p + f)
  }
}

The output looks is below. Scala produces two class files for each of my source files. The code runs mainly in classes with “$” added to the original name. Notice that function fib appears only once, i.e., no stack frames were allocated as i counted down to 0.

java.lang.Exception
	at fibo.FibTailRec$.fib(FibTailRec.scala:8)
	at RunFibTailRec$.fibTailRec(RunFibTailRec.scala:10)
	at RunFibTailRec$.main(RunFibTailRec.scala:6)
	at RunFibTailRec.main(RunFibTailRec.scala)
8

Notice that we displayed the stack without the use of a debugger or external tracing tool, and without throwing an exception. Execution finished, and the value, 8, was displayed.

Code that cannot be tail-call optimized

To demonstrate code ineligible for tail call optimization we introduce a coding error. Replace

case _ => fib(i - 1, f, p + f)

with

case _ => {
      var r: Int = fib(i - 1, f, p + f)
      r
    }

The function now looks like this:

package fibo

object FibTailBad {

  def fib(i: Int, p: Int, f: Int): Int = i match {
    case 0 => p
    case _ => {
      var r: Int = fib(i - 1, f, p + f)
      r
    }
  }
}

The recursive call (fib) is no longer the last in the brace-delimited code block. If you try to use the @tailrec annotation:

package fibo
import scala.annotation.tailrec

object FibTailBad {

  @tailrec def fib(i: Int, p: Int, f: Int): Int = i match {
    case 0 => p
    case _ => {
      var r: Int = fib(i - 1, f, p + f)
      r
    }
  }
}

the compiler throws this error:

could not optimize @tailrec annotated method fib: it contains 
a recursive call not in tail position

No class file is produced. If you display the stack at the recursion termination condition, you see “fib” 7 times, 6 for the case when i > 0 and 1 for the case when i = 0.

java.lang.Exception
	at fibo.FibTailBad$.fib(FibTailBad.scala:8)
	at fibo.FibTailBad$.fib(FibTailBad.scala:12)
	at fibo.FibTailBad$.fib(FibTailBad.scala:12)
	at fibo.FibTailBad$.fib(FibTailBad.scala:12)
	at fibo.FibTailBad$.fib(FibTailBad.scala:12)
	at fibo.FibTailBad$.fib(FibTailBad.scala:12)
	at fibo.FibTailBad$.fib(FibTailBad.scala:12)
	at RunFibTailBad$.fibTailBad(RunFibTailBad.scala:10)
	at RunFibTailBad$.main(RunFibTailBad.scala:6)
	at RunFibTailBad.main(RunFibTailBad.scala)
8

Bytecode listing

It is interesting to compare and contrast the bytecode of the optimized code vs. the non-optimized code. The 9-line and 12-line Scala files (respectively) expand to 71-line and 78-line bytecode listings. If I had not isolated function fib, the listing would have been much longer. The optimized code:

public final class fibo/FibTailRec$ {
     <ClassVersion=52>
     <SourceFile=FibTailRec.scala>

     public static fibo.FibTailRec$ MODULE$;

     public static  { //  //()V
             new fibo/FibTailRec$
             invokespecial fibo/FibTailRec$.()V
             return
     }

     public fib(int arg0, int arg1, int arg2) { //(III)I
         <localVar:index=0 , name=this , desc=Lfibo/FibTailRec$;, sig=null, start=L1, end=L2>
         <localVar:index=1 , name=i , desc=I, sig=null, start=L1, end=L2>
         <localVar:index=2 , name=p , desc=I, sig=null, start=L1, end=L2>
         <localVar:index=3 , name=f , desc=I, sig=null, start=L1, end=L2>

         L1 {
             f_new (Locals[4]: fibo/FibTailRec$, 1, 1, 1) (Stack[0]: null)
             iload1 // reference to arg0
             istore5
             iload5
             tableswitch 
                val: 0 -> L3
                default -> L4
         }
         L3 {
             f_new (Locals[6]: fibo/FibTailRec$, 1, 1, 1, 0, 1) (Stack[0]: null)
             iload2 // reference to arg1
             goto L5
         }
         L4 {
             f_new (Locals[6]: fibo/FibTailRec$, 1, 1, 1, 0, 1) (Stack[0]: null)
             iload1 // reference to arg0
             iconst_1
             isub
             iload3
             iload2 // reference to arg1
             iload3
             iadd
             istore3
             istore2 // reference to arg1
             istore1 // reference to arg0
             goto L1
         }
         L5 {
             f_new (Locals[6]: fibo/FibTailRec$, 1, 1, 1, 0, 1) (Stack[1]: 1)
             ireturn
         }
         L2 {
         }
     }

     private FibTailRec$() { //  //()V
         <localVar:index=0 , name=this , desc=Lfibo/FibTailRec$;, sig=null, start=L1, end=L2>

         L1 {
             aload0 // reference to self
             invokespecial java/lang/Object.()V
             aload0 // reference to self
             putstatic fibo/FibTailRec$.MODULE$:fibo.FibTailRec$
         }
         L3 {
             return
         }
         L2 {
         }
     }

Scala: [B@2ddd5edcScalaInlineInfo: [B@1a12f6f1}

The unoptimized code:

public final class fibo/FibTailBad$ {
     <ClassVersion=52>
     <SourceFile=FibTailBad.scala>

     public static fibo.FibTailBad$ MODULE$;

     public static  { //  //()V
             new fibo/FibTailBad$
             invokespecial fibo/FibTailBad$.()V
             return
     }

     public fib(int arg0, int arg1, int arg2) { //(III)I
         <localVar:index=5 , name=r , desc=I, sig=null, start=L1, end=L2>
         <localVar:index=0 , name=this , desc=Lfibo/FibTailBad$;, sig=null, start=L3, end=L4>
         <localVar:index=1 , name=i , desc=I, sig=null, start=L3, end=L4>
         <localVar:index=2 , name=p , desc=I, sig=null, start=L3, end=L4>
         <localVar:index=3 , name=f , desc=I, sig=null, start=L3, end=L4>

         L3 {
             iload1 // reference to arg0
             istore4
             iload4
             tableswitch 
                val: 0 -> L5
                default -> L6
         }
         L5 {
             f_new (Locals[5]: fibo/FibTailBad$, 1, 1, 1, 1) (Stack[0]: null)
             iload2 // reference to arg1
             goto L7
         }
         L6 {
             f_new (Locals[5]: fibo/FibTailBad$, 1, 1, 1, 1) (Stack[0]: null)
             aload0 // reference to self
             iload1 // reference to arg0
             iconst_1
             isub
             iload3
             iload2 // reference to arg1
             iload3
             iadd
             invokevirtual fibo/FibTailBad$.fib(III)I
         }
         L1 {
             istore5
         }
         L8 {
             iload5
         }
         L2 {
             goto L7
         }
         L7 {
             f_new (Locals[5]: fibo/FibTailBad$, 1, 1, 1, 1) (Stack[1]: 1)
             ireturn
         }
         L4 {
         }
     }

     private FibTailBad$() { //  //()V
         <localVar:index=0 , name=this , desc=Lfibo/FibTailBad$;, sig=null, start=L1, end=L2>

         L1 {
             aload0 // reference to self
             invokespecial java/lang/Object.()V
             aload0 // reference to self
             putstatic fibo/FibTailBad$.MODULE$:fibo.FibTailBad$
         }
         L3 {
             return
         }
         L2 {
         }
     }

Scala: [B@6cec5b09ScalaInlineInfo: [B@7eea59ce}

Comparison of stacks

The Fibonacci calculation is in block L4 (optimized) and block L6 (not optimized). The optimized code breakdown follows:

bytecode description depth
iload1 // reference to arg0 push i 1
iconst_1 push 1 2
isub pop I, pop 1, push 1 + 1 1
iload3 push f 2
iload2 // reference to arg1 push p 3
iload3 push f 4
iadd pop p, pop f, push p + f 3
istore3 pop and store p + f 2
istore2 // reference to arg1 pop and store p 1
istore1 // reference to arg0 pop and store I + 1 0
goto L1

Notice that the optimized code block ends with nothing on the stack and a goto to L1, the loop termination test.

The non-optimized code analysis (block L6) is:

bytecode description depth
aload0 // reference to self push return address on stack 1
iload1 // reference to arg0 push i 2
iconst_1 push 1 3
isub pop i, pop 1, push i – 1 2
iload3 push f 3
iload2 // reference to arg1 push p 4
iload3 push f 5
iadd pop p, pop f, push p + f 4
invokevirtual fibo/FibTailBad$.fib(III)I call fib

Leading up to the recursive call, the stack holds:

  • the return address
  • the decremented counter
  • the previous Fibonacci number
  • the new Fibonacci number

No tail-call optimization in java

If you try the above analysis on java code, you will find that it is not tail-code optimized. Java does not support tail-call optimization. For example:

	private static int fib(int i, int p, int f) {
		switch (i) {
		case 0:
			new Exception().printStackTrace();
			return p;
		default:
			return fib(i - 1, f, p + f);
		}
	}


Decompiling

It is impossible to recover the original source code from the bytecode. Furthermore, it is impossible to infer recursion from iteration. Finally, the decompiler returns Java code, not Scala. Bytecode Viewer has several decompilers to choose from. Here is the output from one of the decompilers.

package fibo;

public final class FibTailRec$ {
   public static FibTailRec$ MODULE$;

   static {
      new FibTailRec$();
   }

   public int fib(int i, int p, int f) {
      while(true) {
         switch(i) {
         case 0:
            return p;
         default:
            int var10000 = i - 1;
            int var10001 = f;
            f += p;
            p = var10001;
            i = var10000;
         }
      }
   }

   private FibTailRec$() {
      MODULE$ = this;
   }
}

The switch default block corresponds to bytecode block L4, analyzed earlier. I chose this listing because it shows the block-scope variables var10000 and var10001 that hold temporary results.

Remarks

For various reasons, people decide to code in Scala. When they do, interest in system implementation and application performance can arise. It can be helpful for administrators to be familiar with the technology and the underlying mechanisms.

This posting is outside my field. Comments, suggestions, and corrections are welcome and will be acknowledged.

Summary

  • Functional language programmers tend to implement iteration as recursion.
  • A common case of recursion is tail call recursion.
  • The optimizer can eliminate the tail call.
  • The @tailrec decorator can cause the optimizer to report which routines cannot be tail-call optimized.
  • It is possible to inadvertently defeat tail call optimization.
  • Exception().printStackTrace() can demonstrate tail-call optimized.
  • Like Java, the Scala compiler produces bytecode that is executable by the java virtual machine.
  • Bytecode Viewer, by Konloch, can display the optimization.
  • Hand tracing bytecode shows the internals of optimized (iterative) code compared to recursive code.
  • Bytecode Viewer decompiles the optimized bytecode to iterative java, not the original, recursive Scala.
  • Java does not support tail call optimization.

Notes on histograms

By Brian Fitzgerald

This blog post is a worked example of Oracle histograms. In this case, a frequency histogram is demonstrated in the context of a single table query.

Setup

cr.histodemo.sql

Table ords. Intended column data distribution:

10000 rows
10000 unique ordid
1000 categories, evenly distributed
2 distinct status, skewed
99.99% COMPLETE
0.01% PENDING

One index on each column, ORDID, CATEGORYID, and STATUS.

Not null constraints are there to simplify the demonstration.

whenever oserror exit 1
@ sqlerc.sql
drop table ords purge;
@ sqlerx.sql

create table ords
(
ordid number not null,
categoryid number not null,
status varchar2(10) not null
);

insert into ords ( ordid, categoryid, status )
select
level,
mod( level, 1000 ),
case mod( level, 10000) when 0 then 'PENDING' else 'COMPLETE' end
from dual
connect by level <= 10000;

alter table ords add constraint ords primary key ( ordid );
create index category_idx on ords ( categoryid );
create index status_idx on ords ( status );

quit

output:

[oracle@stormking db12201 stats]$ sqlplus u/u @ cr.histodemo.sql
SQL*Plus: Release 12.2.0.1.0 Production on Sun Feb 11 11:37:31 2018
Copyright (c) 1982, 2016, Oracle. All rights reserved.
Last Successful login time: Sun Feb 11 2018 00:10:42 -05:00
Connected to:
Oracle Database 12c Enterprise Edition 
Release 12.2.0.1.0 - 64bit Production
Table dropped.
Table created.
10000 rows created.
Table altered.
Index created.
Index created.
Disconnected from Oracle Database 12c Enterprise Edition 
Release 12.2.0.1.0 - 64bit Production

Execution scripts

query.ords.sql

Thwo queries on table ords.

  1. equality predicate on STATUS only
  2. equality predicate on STATUS and CATEGORYID

The 10053 trace shows optimizer’s rationale.

set linesize 100
@ sqlerx.sql
column plan_table_output format a80

@ set.tracefile.identifier.sql status
@ trace.10053.on.sql

select ordid from ords
where status = 'PENDING'
;
select * from table(dbms_xplan.display_cursor( format=>'basic' ));
@ trace.10053.off.sql

@ set.tracefile.identifier.sql cat
@ trace.10053.on.sql

select ordid from ords
where categoryid = 0
and status = 'COMPLETE'
;
select * from table(dbms_xplan.display_cursor( format=>'basic' ));
@ trace.10053.off.sql

rpt.col.usage.sql

Script to show what types of workload has run on the columns. Database monitoring is flushed for the sake of displaying the col_usage report before gathering stats in this demonstration. Gather stats automatically flushes column usagem so alling flush_database_monitoring_info is generally not required.

define ownname=&&1
define tabname=&&2
whenever oserror exit 1
@ sqlerx.sql
@ l32k.p50k.sql

set verify off

set long 2000000000
exec dbms_stats.flush_database_monitoring_info;
column rpt format a160
select dbms_stats.report_col_usage('&&ownname','&&tabname') rpt from dual;

gather.table.stats.sql

Invalidation, in this case, is to force a 10053 trace for the sake of this demonstration. The 10046 trace and tkprof is for checking what queries on ords get run during gather stats. With the exception of no_invalidate, dbms_stats is run with the default options to show how histograms are gathered automatically during routine database maintenance. Estimate_percent defaults to auto_sample_size. Gathering or deleting a histogram can be forced by using option method_opt.

define ownname=&&1
define tabname=&&2
whenever oserror exit 1
@ sqlerx.sql
set verify off

@ set.tracefile.identifier.sql stats
@ trace.10046.on.sql

begin
 dbms_stats.gather_table_stats (
 ownname => '&&ownname',
 tabname => '&&tabname',
 no_invalidate => false
 );
end;
/
prompt done gather stats on &&ownname..&&tabname

@ trace.10046.off.sql
@ tkprof.sql

user.tab.statistics.sql

Script to show the existence or nonexistence of a histogram

define tabname=&&1
whenever oserror exit 1
@ sqlerx.sql
@ l32k.p50k.sql
@ columnformat.sql

select
table_name,
blocks,
num_rows
from user_tab_statistics
where
table_name = '&&tabname';

select
index_name,
leaf_blocks,
num_rows,
distinct_keys
from user_ind_statistics
where table_name = '&&tabname';

select
column_name,
num_distinct,
density,
histogram,
num_buckets
from user_tab_col_statistics
where table_name = '&&tabname';

run.histodemo.sql

The demonstration script

whenever oserror exit 1
@ spoolfile.uniq.sql ords

@ rpt.col.usage.sql U ORDS
@ gather.table.stats.sql U ORDS
@ user.tab.statistics.sql ORDS
@ query.ords.sql

@ spooloff.sql
quit

Execution run 1

Files

ords.db12201.20180211.142321.84.txt

run.histodemo.sql output

db12201_ora_20225_STATS.trc

10043 trace of gather table stats

db12201_ora_20225_STATS.tkp

tkprof of gather table stats

db12201_ora_20225_STATUS.trc

10053 trace of “where status = ‘PENDING'”

db12201_ora_20225_CAT.trc

10053 trace of “where categoryid = 0 and status = ‘COMPLETE'”

Highlights

  • Because table ords is newly created, the column usage report shows no workload
  • Gather stats ran four queries on table ords, namely a full table scan and one per index.
$ grep -i '"U"."ORDS" t' db12201_ora_20225_STATS.tkp
 "U"."ORDS" t /* ACL,NIL,NIL,NDV,NIL,NIL,NDV,NIL,NIL*/
 "U"."ORDS" t where "ORDID" is not null
 "U"."ORDS" t where "CATEGORYID" is not null
 "U"."ORDS" t where "STATUS" is not null
  • No histogram was gathered
  • ORDID is most selective column, having the highest num_distinct and lowest density
  • CATEGORYID is medium-selective
  • STATUS is not, in general, selective, having only 2 distinct values
COLUMN_NAME NUM_DISTINCT DENSITY HISTOGRAM NUM_BUCKETS
------------------------------ ------------ ---------- -------------------
ORDID 10000 .0001 NONE 1
CATEGORYID 1000 .001 NONE 1
STATUS 2 .5 NONE 1
  • No histogram is present on status. Density is computed:

density = 1 / num_distinct = 1/2 = .5

  • “where status = ‘PENDING'” catches a full table scan
----------------------------------
| Id | Operation | Name |
----------------------------------
| 0 | SELECT STATEMENT | |
| 1 | TABLE ACCESS FULL| ORDS |
----------------------------------
  • “where categoryid = 0 and status = ‘COMPLETE'” catches an index range scan
------------------------------------------------------------
| Id | Operation | Name |
------------------------------------------------------------
| 0 | SELECT STATEMENT | |
| 1 | TABLE ACCESS BY INDEX ROWID BATCHED| ORDS |
| 2 | INDEX RANGE SCAN | CATEGORY_IDX |
-----------------------------------------------------------

Execution run 2

Files

ords.db12201.20180211.142525.84.txt

run.histodemo.sql output for run 2.

db12201_ora_20607_STATS.trc

db12201_ora_20607_STATS.tkp

Gather stats 10046 trace and tkprof.

db12201_ora_20607_STATUS.trc

db12201_ora_20607_CAT.trc

10053 trace again for the queries, “where status” and “where categoryid …
and status”.

Highlights

  • The column usage report shows that equality predicates have run on columns CATEGORYID and STATUS.
COLUMN USAGE REPORT FOR U.ORDS
..............................

1. CATEGORYID : EQ
2. STATUS : EQ
  • This time, gather stats ran six queries on table ords.
$ grep -i '"U"."ORDS" t' db12201_ora_20607_STATS.tkp | wc -l
6
  • gather table stats ran this query on column STATUS:
select 
/*+ no_parallel(t) no_parallel_index(t) dbms_stats 
cursor_sharing_exact use_weak_name_resl dynamic_sampling(0) 
no_monitoring xmlindex_sel_idx_tbl 
opt_param('optimizer_inmemory_aware' 'false') no_substrb_pad 
*/
 substrb(dump("STATUS",16,0,64),1,240) val,
 rowidtochar(rowid) rwid 
from "U"."ORDS" t 
where rowid in (
chartorowid('AAAWt1AAHAAAAFjAAA'),
chartorowid('AAAWt1AAHAAAAGCAAv')) 
order by "STATUS"

Clearly, the only purpose is to obtain the two unique STATUS values.

  • Gather stats ran this query on column CATEGORYID:
select 
substrb(dump(val,16,0,64),1,240) ep, 
freq, 
cdn, 
ndv,
(sum(pop) over()) popcnt,
(sum(pop*freq) over()) popfreq,
substrb(dump(max(val) over(),16,0,64),1,240) maxval,
substrb(dump(min(val) over(),16,0,64),1,240) minval
from
 (
select val, 
freq, 
(sum(freq) over()) cdn, 
(count(*) over()) ndv,
(case when freq > ((sum(freq) over())/254) then 1 else 0 end) pop
from (select
  /*+ no_parallel(t) no_parallel_index(t) dbms_stats
    cursor_sharing_exact use_weak_name_resl dynamic_sampling(0) 
    no_monitoring xmlindex_sel_idx_tbl 
    opt_param('optimizer_inmemory_aware' 'false') no_substrb_pad
 */
  "CATEGORYID" val, 
  count("CATEGORYID") freq 
from "U"."ORDS" t 
where "CATEGORYID" is not null 
group by "CATEGORYID"
)) order by val

Inference: dbms_stats is collecting information needed to construct a histogram on STATUS and CATEGORYID.

Notice the column name “ep”, which could refer to a histogram endpoint value.

“pop” = 1 if popular, 0 if non-popular.

  • dbms_stats stored a histogram for column status but not for categoryid
COLUMN_NAME NUM_DISTINCT DENSITY HISTOGRAM NUM_BUCKETS
------------------------------ ------------ ---------- ------- -----------
ORDID 10000 .0001 NONE 1
CATEGORYID 1000 .001 NONE 1
STATUS 2 .00005 FREQUENCY 2

Inference: dbms_stats found skew in status but not in categoryid

  • The reported density on column status has changed:
82c84
< STATUS 2 .5 NONE 1
---
> STATUS 2 .00005 FREQUENCY 2

According to 2007 note New Density calculation in 11g by Alberto Dell’Era, density = 0.5 / num_rows for frequency histograms. Dell’Era’s paper refers only to not null values. In other words, for frequency histograms, density, as stored in the catalog, should be

density = .5 / num_values = .5 / ( num_rows – num_nulls )

I have found this to be accurate to within 2.5e-15 for 99% out of the 30,000 frequency histograms in one example database, where the histograms were mostly gathered with Oracle 11.1.0.7 binaries. After gathering statistics with Oracle 12.1.0.2 binaries, dba_tab_col_statistics density is found to agree with formula .5 / ( num_rows – num_nulls ) to within 2.5e-15 for 99.95% of all frequency histograms.This formula is found to apply only for the cases where num_distinct >1. For the remaining 0.05%, the density is within 2% of the formula. All the discrepant densities are IOTs; however, not all IOTs are discrepant, so I must be missing some detail.

In this example, num_values = 10000 – 0 = 10000. Density = .5 / 10000 = 0.00005.

The endpoint values are, roughly, using cre_hist_funcs.sql, function hist_numtochar, by Martin Widlake:

ENDPOINT_NUMBER VAL
--------------- ----------
 9999 COMPLEP
 10000 PENDIN<

Comment: density is used to cost predicates on non-popular values.

“where status = ‘COMPLETE'” remains non-selective.

“where status =’PENDING'” is selective.

Compare run without histogram vs run with histogram

where status =’PENDING’

diff run1/db12201_ora_20225_STATUS.trc run2/db12201_ora_20607_STATUS.trc

Output here: 10053 diff: where status = ‘PENDING’

There several points of interest in the 10053 trace comparison

  • With the histogram, the selectivity of status=’PENDING’ is 1.0000e-4, which is exactly correct.
875,876c877,879
< AvgLen: 9 NDV: 2 Nulls: 0 Density: 0.500000
< Estimated selectivity: 0.500000 , col: #3
---
> AvgLen: 9 NDV: 2 Nulls: 0 Density: 0.000050
> Histogram: Freq #Bkts: 2 UncompBkts: 10000 EndPtVals: 2 ActualVal: no
> Estimated selectivity: 1.0000e-04 , endpoint value predicate, col: #3
  • The plan changes thus:
1016,1021c1028,1034
< -------------------------------------+-----------------------------------+
< | Id | Operation | Name | Rows | Bytes | Cost | Time |
< -------------------------------------+-----------------------------------+
< | 0 | SELECT STATEMENT | | | | 11 | |
< | 1 | TABLE ACCESS FULL | ORDS | 5000 | 63K | 11 | 00:00:01 |
< -------------------------------------+-----------------------------------+
---
> ---------------------------------------------------------+-----------------------------------+
> | Id | Operation | Name | Rows | Bytes | Cost | Time |
> ---------------------------------------------------------+-----------------------------------+
> | 0 | SELECT STATEMENT | | | | 2 | |
> | 1 | TABLE ACCESS BY INDEX ROWID BATCHED | ORDS | 1 | 13 | 2 | 00:00:01 |
> | 2 | INDEX RANGE SCAN | STATUS_IDX| 1 | | 1 | 00:00:01 |
> ---------------------------------------------------------+-----------------------------------+

where categoryid = 0 and status = ‘COMPLETE’

diff run1/db12201_ora_20225_CAT.trc run2/db12201_ora_20607_CAT.trc

output here: 10053 diff: where categoryid and status

  • With a histogram, the estimated cost of using an index to access a popular value is higher. All the more reason not to use STATUS_IDX
 917 Access Path: index (AllEqRange)
 918 Index: STATUS_IDX
919,921c922,924
< resc_io: 30.000000 resc_cpu: 2414493
< ix_sel: 0.500000 ix_sel_with_filters: 0.500000
< Cost: 30.064126 Resp: 30.064126 Degree: 1
---
> resc_io: 60.000000 resc_cpu: 4827696
> ix_sel: 0.999900 ix_sel_with_filters: 0.999900
> Cost: 60.128217 Resp: 60.128217 Degree: 1
  • The cost of CATEGORY_IDX is unchanged.
 904 ****** Costing Index CATEGORY_IDX
 905 SPD: Return code in qosdDSDirSetup: NOCTX, estType = INDEX_SCAN
 906 SPD: Return code in qosdDSDirSetup: NOCTX, estType = INDEX_FILTER
 907 Estimated selectivity: 0.001000 , col: #2
 908 Access Path: index (AllEqRange)
 909 Index: CATEGORY_IDX
 910 resc_io: 11.000000 resc_cpu: 83586
 911 ix_sel: 0.001000 ix_sel_with_filters: 0.001000
 912 Cost: 11.002220 Resp: 11.002220 Degree: 1
  • CATEGORY_IDX is more selective and less costly than STATUS_IDX. The optimizer chooses CATEGORY_IDX.

Need for histogram in an application

The need for a histogram depends on the application. In this example, no histogram is needed on columns ORDID and CATEGORYID because the values are evenly distributed. There is no skew.

If the application code base consists of only this query, then no histogram is needed on STATUS:

select ordid from ords
where categoryid = 0
and status = 'COMPLETE'

If the application, additionally, has this query, then a histogram is needed on STATUS.

select ordid from ords
where status = 'PENDING'

What about “where status = ‘COMPLETE'”?

The question sometimes arises, what about a query with just “where status = ‘COMPLETE'”. Such a query would access a high number of blocks and return a high number of rows, and would be quickly identified as a poor performer. It is not clear what business value would be served by such a query. Such queries appear less commonly in practical applications.

What about two plans for the same statement?

Histograms are sometimes touted for their usefulness in finding more than one plan for the same sql. This blog post does not identify any such examples.

The hypothetical situation we are describing is:

  • The SQL is the same.
  • The plans are different.
  • In one case, the predicate is on a popular value and in the other case, a rare value.
  • In the popular case, the query may return a high number of rows, or a plan step may return a high number of rows to its antecedent.
  • In the non-popular case, the query accesses few blocks and returns quickly.
  • The popular and non-popular cases have business value.
  • The slower response time of the popular case is acceptable.

Findings

  • Column usage in predicates, as recorded in col_usage$, leads to analyzing for, but not necessarily storage of, histograms.
  • 10053 trace files show the optimizer’s rationale for choosing its final execution plan.
  • In some cases, a histogram helps the optimizer choose a less costly plan.
  • In some cases, a histogram improves the accuracy of a cost computation, but does not affect the final choice of plan.

10053 diff: group by status

[oracle@stormking db12201 12.2]$ diff run1/db12201_ora_20225_GBY.trc run2/db12201_ora_20607_GBY.trc
1c1
< Trace file /u01/app/oracle/diag/rdbms/db12201/db12201/trace/db12201_ora_20225_GBY.trc
---
> Trace file /u01/app/oracle/diag/rdbms/db12201/db12201/trace/db12201_ora_20607_GBY.trc
12,13c12,13
< Oracle process number: 41
< Unix process pid: 20225, image: oracle@stormking (TNS V1-V3)
---
> Oracle process number: 40
> Unix process pid: 20607, image: oracle@stormking (TNS V1-V3)
16,22c16,22
< *** 2018-02-11T14:23:23.367313-05:00
< *** SESSION ID:(84.19304) 2018-02-11T14:23:23.367313-05:00
< *** CLIENT ID:() 2018-02-11T14:23:23.367313-05:00
< *** SERVICE NAME:(SYS$USERS) 2018-02-11T14:23:23.367313-05:00
< *** MODULE NAME:(SQL*Plus) 2018-02-11T14:23:23.367313-05:00
< *** ACTION NAME:() 2018-02-11T14:23:23.367313-05:00
< *** CLIENT DRIVER:(SQL*PLUS) 2018-02-11T14:23:23.367313-05:00
---
> *** 2018-02-11T14:25:27.002021-05:00
> *** SESSION ID:(84.15782) 2018-02-11T14:25:27.002021-05:00
> *** CLIENT ID:() 2018-02-11T14:25:27.002021-05:00
> *** SERVICE NAME:(SYS$USERS) 2018-02-11T14:25:27.002021-05:00
> *** MODULE NAME:(SQL*Plus) 2018-02-11T14:25:27.002021-05:00
> *** ACTION NAME:() 2018-02-11T14:25:27.002021-05:00
> *** CLIENT DRIVER:(SQL*PLUS) 2018-02-11T14:25:27.002021-05:00
25c25
< *** TRACE CONTINUED FROM FILE /u01/app/oracle/diag/rdbms/db12201/db12201/trace/db12201_ora_20225_CAT.trc ***
---
> *** TRACE CONTINUED FROM FILE /u01/app/oracle/diag/rdbms/db12201/db12201/trace/db12201_ora_20607_CAT.trc ***
27c27
< Registered qb: SEL$1 0xf972ef68 (PARSER)
---
> Registered qb: SEL$1 0x6bfd6f68 (PARSER)
862c862
< Registered qb: SEL$1 0xf94dbf10 (COPY SEL$1)
---
> Registered qb: SEL$1 0x6c4d9b28 (COPY SEL$1)
876c876
< call(in-use=1736, alloc=16344), compile(in-use=130400, alloc=139528), execution(in-use=2936, alloc=4032)
---
> call(in-use=1736, alloc=16344), compile(in-use=130400, alloc=136232), execution(in-use=2936, alloc=4032)
879c879
< call(in-use=1736, alloc=16344), compile(in-use=126272, alloc=139528), execution(in-use=2936, alloc=4032)
---
> call(in-use=1736, alloc=16344), compile(in-use=126272, alloc=136232), execution(in-use=2936, alloc=4032)
883c883
< call(in-use=1736, alloc=16344), compile(in-use=126272, alloc=139528), execution(in-use=2936, alloc=4032)
---
> call(in-use=1736, alloc=16344), compile(in-use=126272, alloc=136232), execution(in-use=2936, alloc=4032)
888c888
< call(in-use=1736, alloc=16344), compile(in-use=126680, alloc=139528), execution(in-use=2936, alloc=4032)
---
> call(in-use=1736, alloc=16344), compile(in-use=126704, alloc=136232), execution(in-use=2936, alloc=4032)
891c891
< call(in-use=1736, alloc=16344), compile(in-use=126800, alloc=139528), execution(in-use=2936, alloc=4032)
---
> call(in-use=1736, alloc=16344), compile(in-use=126824, alloc=136232), execution(in-use=2936, alloc=4032)
897c897
< call(in-use=1736, alloc=16344), compile(in-use=126800, alloc=139528), execution(in-use=2936, alloc=4032)
---
> call(in-use=1736, alloc=16344), compile(in-use=126824, alloc=136232), execution(in-use=2936, alloc=4032)
901c901
< call(in-use=1736, alloc=16344), compile(in-use=127208, alloc=139528), execution(in-use=2936, alloc=4032)
---
> call(in-use=1736, alloc=16344), compile(in-use=127272, alloc=136232), execution(in-use=2936, alloc=4032)
904c904
< call(in-use=1736, alloc=16344), compile(in-use=127328, alloc=139528), execution(in-use=2936, alloc=4032)
---
> call(in-use=1736, alloc=16344), compile(in-use=127392, alloc=136232), execution(in-use=2936, alloc=4032)
911c911
< call(in-use=1736, alloc=16344), compile(in-use=127328, alloc=139528), execution(in-use=2936, alloc=4032)
---
> call(in-use=1736, alloc=16344), compile(in-use=127392, alloc=136232), execution(in-use=2936, alloc=4032)
916c916
< call(in-use=1736, alloc=16344), compile(in-use=127736, alloc=139528), execution(in-use=2936, alloc=4032)
---
> call(in-use=1736, alloc=16344), compile(in-use=127800, alloc=136232), execution(in-use=2936, alloc=4032)
919c919
< call(in-use=1736, alloc=16344), compile(in-use=127856, alloc=139528), execution(in-use=2936, alloc=4032)
---
> call(in-use=1736, alloc=16344), compile(in-use=127920, alloc=136232), execution(in-use=2936, alloc=4032)
927c927
< call(in-use=1736, alloc=16344), compile(in-use=127856, alloc=139528), execution(in-use=2936, alloc=4032)
---
> call(in-use=1736, alloc=16344), compile(in-use=127920, alloc=136232), execution(in-use=2936, alloc=4032)
930c930
< call(in-use=1736, alloc=16344), compile(in-use=128264, alloc=139528), execution(in-use=2936, alloc=4032)
---
> call(in-use=1736, alloc=16344), compile(in-use=128328, alloc=136232), execution(in-use=2936, alloc=4032)
933c933
< call(in-use=1736, alloc=16344), compile(in-use=128424, alloc=139528), execution(in-use=2936, alloc=4032)
---
> call(in-use=1736, alloc=16344), compile(in-use=128448, alloc=136232), execution(in-use=2936, alloc=4032)
949c949
< call(in-use=1736, alloc=16344), compile(in-use=129680, alloc=139528), execution(in-use=2936, alloc=4032)
---
> call(in-use=1736, alloc=16344), compile(in-use=129728, alloc=136232), execution(in-use=2936, alloc=4032)
951c951
< kkoqbc-subheap (create addr=0x7fddf9729810)
---
> kkoqbc-subheap (create addr=0x7f286bfd1810)
991a992,993
> Column (#3):
> NewDensity:0.000050, OldDensity:0.000050 BktCnt:10000.000000, PopBktCnt:9999.000000, PopValCnt:1, NDV:2
993c995,996
< AvgLen: 9 NDV: 2 Nulls: 0 Density: 0.500000
---
> AvgLen: 9 NDV: 2 Nulls: 0 Density: 0.000050
> Histogram: Freq #Bkts: 2 UncompBkts: 10000 EndPtVals: 2 ActualVal: no
1145c1148
< kkoqbc-subheap (delete addr=0x7fddf9729810, in-use=27312, alloc=32840)
---
> kkoqbc-subheap (delete addr=0x7f286bfd1810, in-use=27312, alloc=32840)
1148c1151
< call(in-use=9832, alloc=65656), compile(in-use=133208, alloc=139528), execution(in-use=2936, alloc=4032)
---
> call(in-use=9624, alloc=65656), compile(in-use=135032, alloc=136232), execution(in-use=2936, alloc=4032)
1154c1157
< call(in-use=9832, alloc=65656), compile(in-use=136304, alloc=139528), execution(in-use=2936, alloc=4032)
---
> call(in-use=9624, alloc=65656), compile(in-use=138208, alloc=140376), execution(in-use=2936, alloc=4032)
3080c3083
< SEL$1 0xf972ef68 (PARSER) [FINAL]
---
> SEL$1 0x6bfd6f68 (PARSER) [FINAL]
3083c3086
< call(in-use=12280, alloc=65656), compile(in-use=159680, alloc=218968), execution(in-use=7392, alloc=8088)
---
> call(in-use=12072, alloc=65656), compile(in-use=161568, alloc=223424), execution(in-use=7392, alloc=8088)

SQL*Net break/reset to client

By Brian Fitzgerald

Introduction

This is a demonstration of event SQL*Net break/reset to client. This demo will assist understanding the origin of SQL*Net break/reset to client events on your database. The application details leading to SQL*Net break/reset to client may not be directly accessible to the DBA.

A session waits on SQL*Net break/reset to client when an error happens and the Oracle instance is trying to notify the client. Until the client acknowledges, the session waits on event SQL*Net break/reset to client. SQL*Net break/reset to client waits appear in the OEM display under the Application wait class.

To simulate the scenario, I run a sqlplus script that will sleep and eventually get an error. Before the error is reached, I suspend the client, so that it cannot receive any message from the instance. As a result, the session waits on SQL*Net break/reset to client.

Event SQL*Net break/reset to client is similar to SQL*Net message to client and SQL*Net more data to client in the sense that that Oracle has some information to communicate to the client. The waiting will persist if the client is preoccupied. Whereas “break/reset” is in the Application wait class, “message” and “more data” waits are in the Network wait class.

In summary, SQL*Net break/reset to client means that an error occurred and Oracle is trying to notify the client.

Demo

For this demonstration, I will open three windows:

  1. Run a PL/SQL script
  2. Suspend the batch, sleep, and resume the batch
  3. Check the event in v$session

Script

Here is the script used for the demo.

$ cat sqlnet.break.reset.sql
@ conn.pdba.u.sql
set verify off

declare
 l_rslt number;
begin
 dbms_lock.sleep(&&1);
 l_rslt := 0/0;
end;
/
quit

Oracle will sleep, reach division by zero, and try to notify the client about the error.

Window 1:

$ sqlplus /nolog @ sqlnet.break.reset.sql 20 & fg
[1] 30878
sqlplus /nolog @ sqlnet.break.reset.sql 20

SQL*Plus: Release 12.2.0.1.0 Production on Sat Nov 4 16:23:32 2017

Copyright (c) 1982, 2016, Oracle. All rights reserved.

Connected.

Note that the process id is 30878.

Window 2:

Here we want to simulate an client process that should be waiting for the oracle server, but is preoccupied with something else. We do that by suspending sqlplus for 120 seconds.

$ kill -STOP 30878 ; sleep 120 ; kill -CONT 30878

Window 1:

sqlplus responds

[1]+ Stopped sqlplus /nolog @ sqlnet.break.reset.sql 20

Window 3:

In fact, Oracle has tried to notify the application (sqlplus), and is waiting on a response that will not come until the client wakes up. I.e. the session is waiting on SQL*Net break/reset to client.

SQL> select sid, sql_id, event, p2, p2text 
from v$session 
where service_name = 'u' 
and sid != sys_context('userenv','sid');

 SID SQL_ID        EVENT                           P2 P2TEXT
---- ------------- ------------------------------ --- ------
 63                SQL*Net break/reset to client    0 break?

The text for p2, in this case, is “break?”. Nonzero means break and 0 means reset, so this case is a reset, which is the more common case.

sql_id is null. The session is a running statement not now, but in the past. An error occurred, and Oracle is trying to notify the client. In most cases of SQL*Net break/reset to client, sql_id will be null.

At this point, I have staged a scenario with SQL*Net break/reset to client.

Window 1:

After 120 seconds, window 2 issues kill -CONT 30878. sqlplus wakes up. The output appears:

$ declare
*
ERROR at line 1:
ORA-01476: divisor is equal to zero
ORA-06512: at line 5

Disconnected from Oracle Database 12c Enterprise Edition 
Release 12.2.0.1.0 - 64bit Production

Monitoring

Event SQL*Net break/reset to client appears in OEM in the Application class. Refer to the bright red peak, at right.

active

The bright red region is a hyperlink. You can drill in to the Application class by clicking on it. The display shows the wait breakdown, which shows one session waiting on SQL*Net break/reset to client.

appl

Notice that the Top SQL section is empty. No statement is active. The session appears as a hyperlink, so you can drill down by clicking on Session ID 49.

ses

Impact

One session waiting on SQL*Net break/reset to client will probably have no adverse impact on the instance, or on other sessions. If the session is in a critical batch, then resolving this wait issue will be a high priority. In some cases, SQL*Net break/reset to client appears as a result of manual operation of various tools.

The Application class

We often associate the Application class with blocking, such as the row-level locking that leads to, enq: TX – row lock contention, or the enq: TM – contention waits associated with select for update or missing foreign key indexes. Those waits are associated with statements, and with tables or indexes. SQL*Net break/reset to client, although it is in the Application class, is not associated with a SQL statement or with locking. However, the name “Application” class is a clue that resolving this wait will require coordination between the DBA and others who develop, manage, or use the application.

Root Causes in Production

In a serious production application, waits on SQL*Net break/reset to client could be a symptom of an application design issue. It could be that the application launches a query and goes off down some other code path while the query is running. When an error appears in the Oracle session, the application is not attending to it right away. In other words, there is a lack of coordination between the client and the Oracle instance. The reason for this could reside in the application design and the database driver, including version and patch status.

Note also that the name SQL*Net break/reset to client does not necessarily mean that there is a network problem. As you can see, resolution of this issue did not require assistance from the network support team, or the operating system administrator.

When investigating issues such as this one, it is helpful to talk to other people who know about other aspects of the application, and engage in a sort of “brainstorming session”.

If you understand the SQL*Net break/reset to client event, you might not be able to resolve it on your own, but you will have an opportunity to lead an investigation that will eventually yield a solution.